 13
13peptides
spectra
0.000 | 0.000
0.000 | 0.000
0.110 | 0.111
0.397 | 0.399
0.000 | 0.000
0.336 | 0.338
0.154 | 0.155
0.000 | 0.000
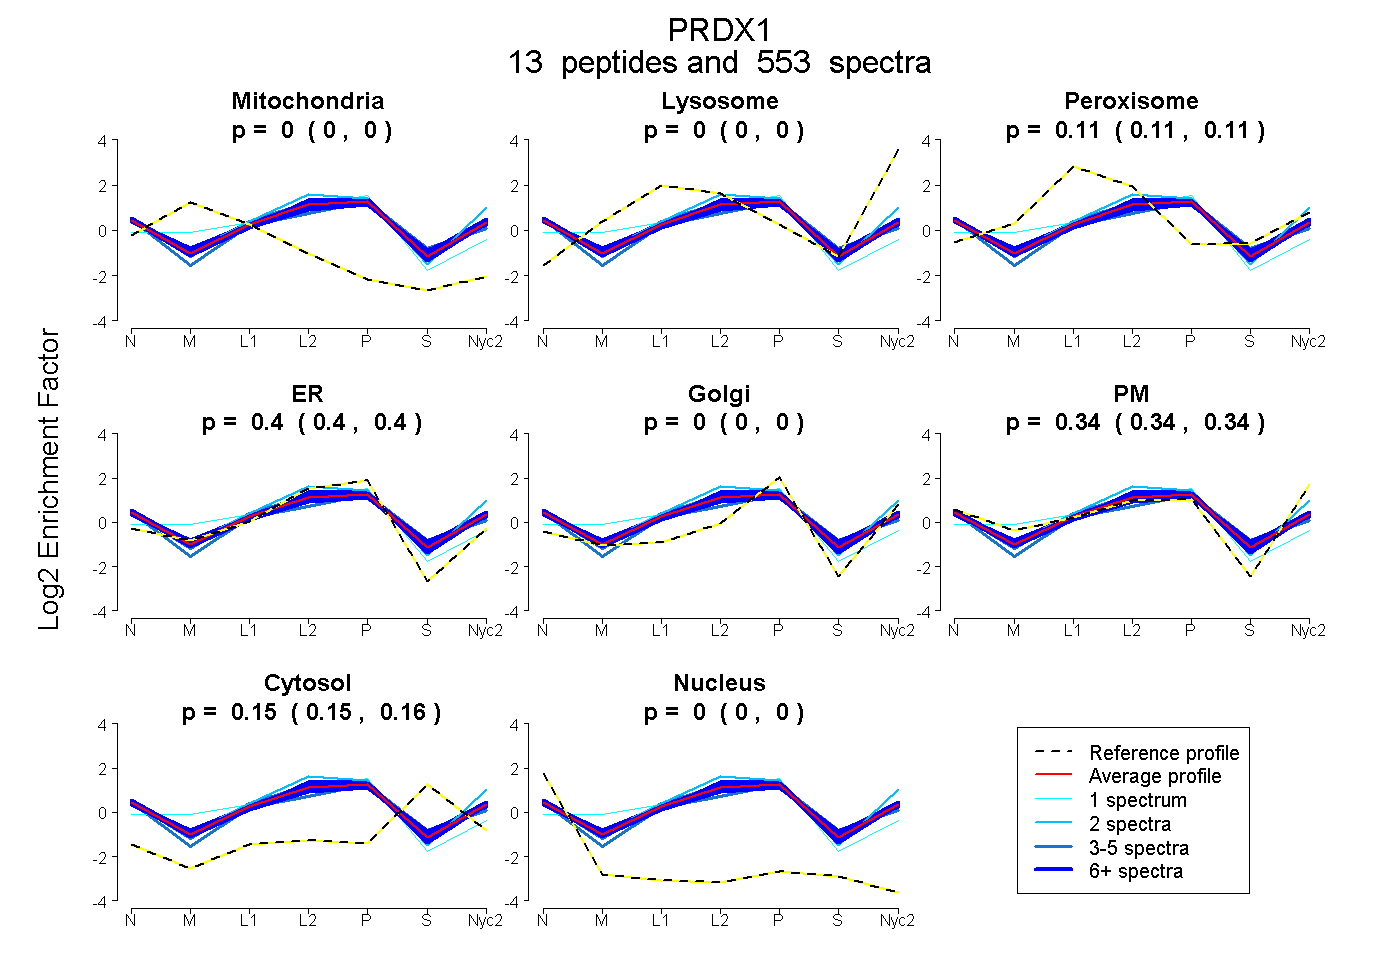
| Plot | Mito | Lyso | Perox | ER | Golgi | PM | Cytosol | Nucleus | |||||
| Expt A |
13 peptides |
553 spectra |
|
0.000 0.000 | 0.000 |
0.000 0.000 | 0.000 |
0.110 0.110 | 0.111 |
0.398 0.397 | 0.399 |
0.000 0.000 | 0.000 |
0.337 0.336 | 0.338 |
0.155 0.154 | 0.155 |
0.000 0.000 | 0.000 |
| 184 spectra, ADEGISFR | 0.000 | 0.000 | 0.132 | 0.335 | 0.000 | 0.382 | 0.151 | 0.000 | ||
| 2 spectra, QGGLGPMNIPLVSDPK | 0.000 | 0.000 | 0.123 | 0.319 | 0.000 | 0.512 | 0.045 | 0.000 | ||
| 17 spectra, LVQAFQFTDK | 0.000 | 0.000 | 0.080 | 0.425 | 0.000 | 0.357 | 0.137 | 0.000 | ||
| 59 spectra, IGHPAPSFK | 0.000 | 0.000 | 0.123 | 0.419 | 0.000 | 0.320 | 0.138 | 0.000 | ||
| 4 spectra, DISLDSYK | 0.000 | 0.000 | 0.059 | 0.415 | 0.000 | 0.270 | 0.256 | 0.000 | ||
| 19 spectra, ATAVMPDGQFK | 0.000 | 0.000 | 0.133 | 0.320 | 0.000 | 0.369 | 0.178 | 0.000 | ||
| 65 spectra, GLFIIDDK | 0.000 | 0.000 | 0.114 | 0.412 | 0.000 | 0.318 | 0.156 | 0.000 | ||
| 55 spectra, QITLNDLPVGR | 0.000 | 0.000 | 0.097 | 0.427 | 0.000 | 0.350 | 0.126 | 0.000 | ||
| 43 spectra, DISLSDYK | 0.000 | 0.000 | 0.105 | 0.349 | 0.000 | 0.334 | 0.212 | 0.000 | ||
| 1 spectrum, EGGGAK | 0.085 | 0.000 | 0.153 | 0.634 | 0.111 | 0.000 | 0.017 | 0.000 | ||
| 18 spectra, TIAQDYGVLK | 0.000 | 0.000 | 0.103 | 0.426 | 0.000 | 0.314 | 0.156 | 0.000 | ||
| 81 spectra, SVDEILR | 0.000 | 0.000 | 0.091 | 0.435 | 0.000 | 0.331 | 0.143 | 0.000 | ||
| 5 spectra, AEEFK | 0.000 | 0.000 | 0.137 | 0.388 | 0.000 | 0.321 | 0.154 | 0.000 |
| Plot | Mito | Lyso or Perox | ER | Golgi | PM | Cytosol | Nucleus | ||||||
| Expt B |
10 peptides |
198 spectra |
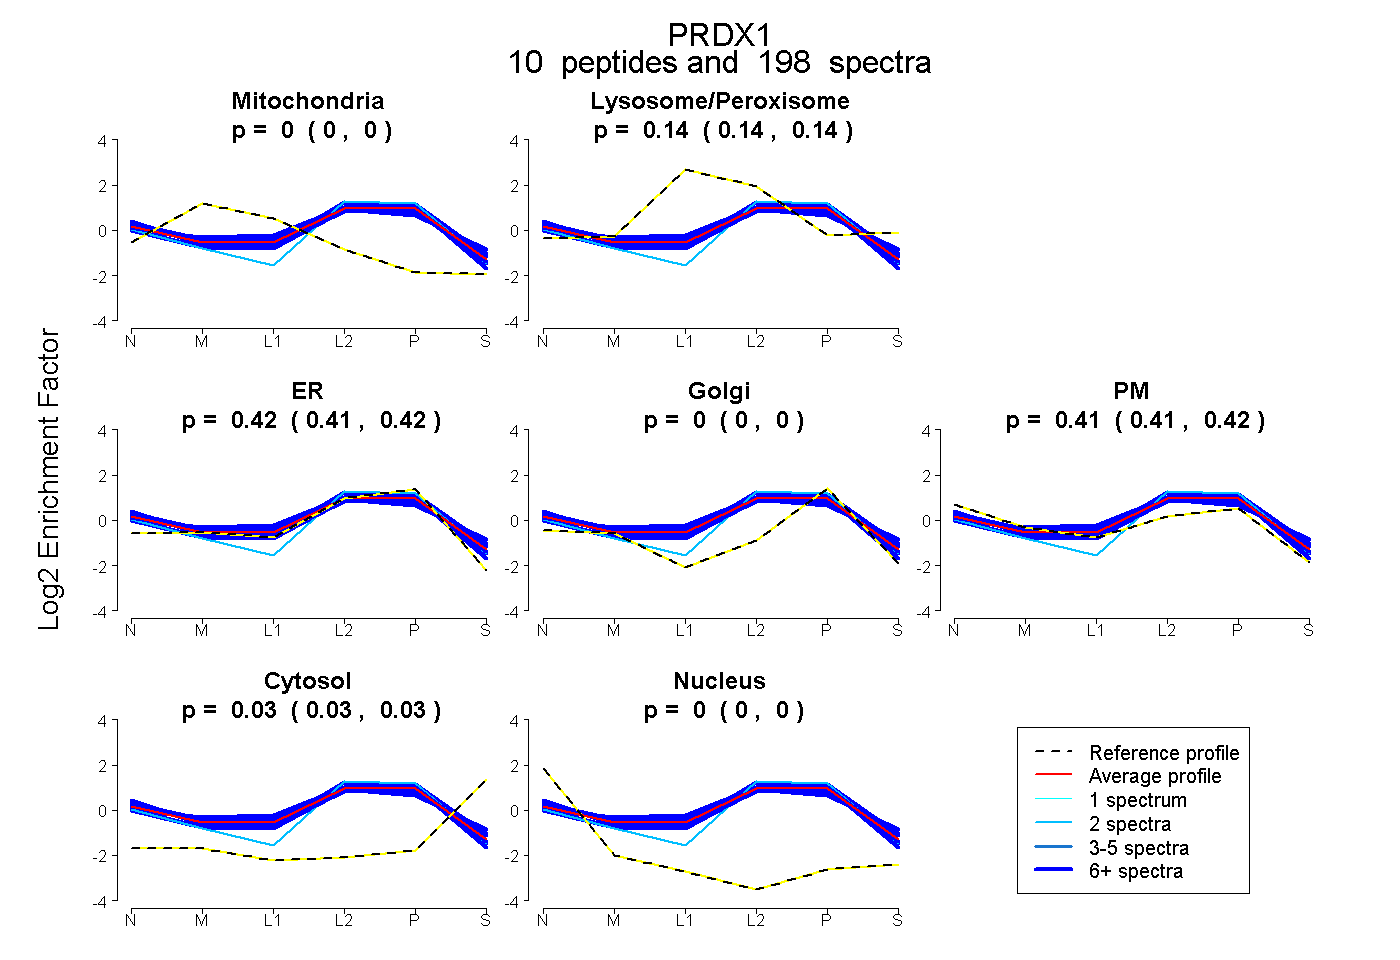 |
0.000 0.000 | 0.000 |
0.142 0.139 | 0.145 |
0.417 0.413 | 0.421 |
0.000 0.000 | 0.000 |
0.413 0.409 | 0.417 |
0.027 0.026 | 0.029 |
0.000 0.000 | 0.000 |
|||
| Plot | Lyso | Other | |||||||||||
| Expt C |
12 peptides |
676 spectra |
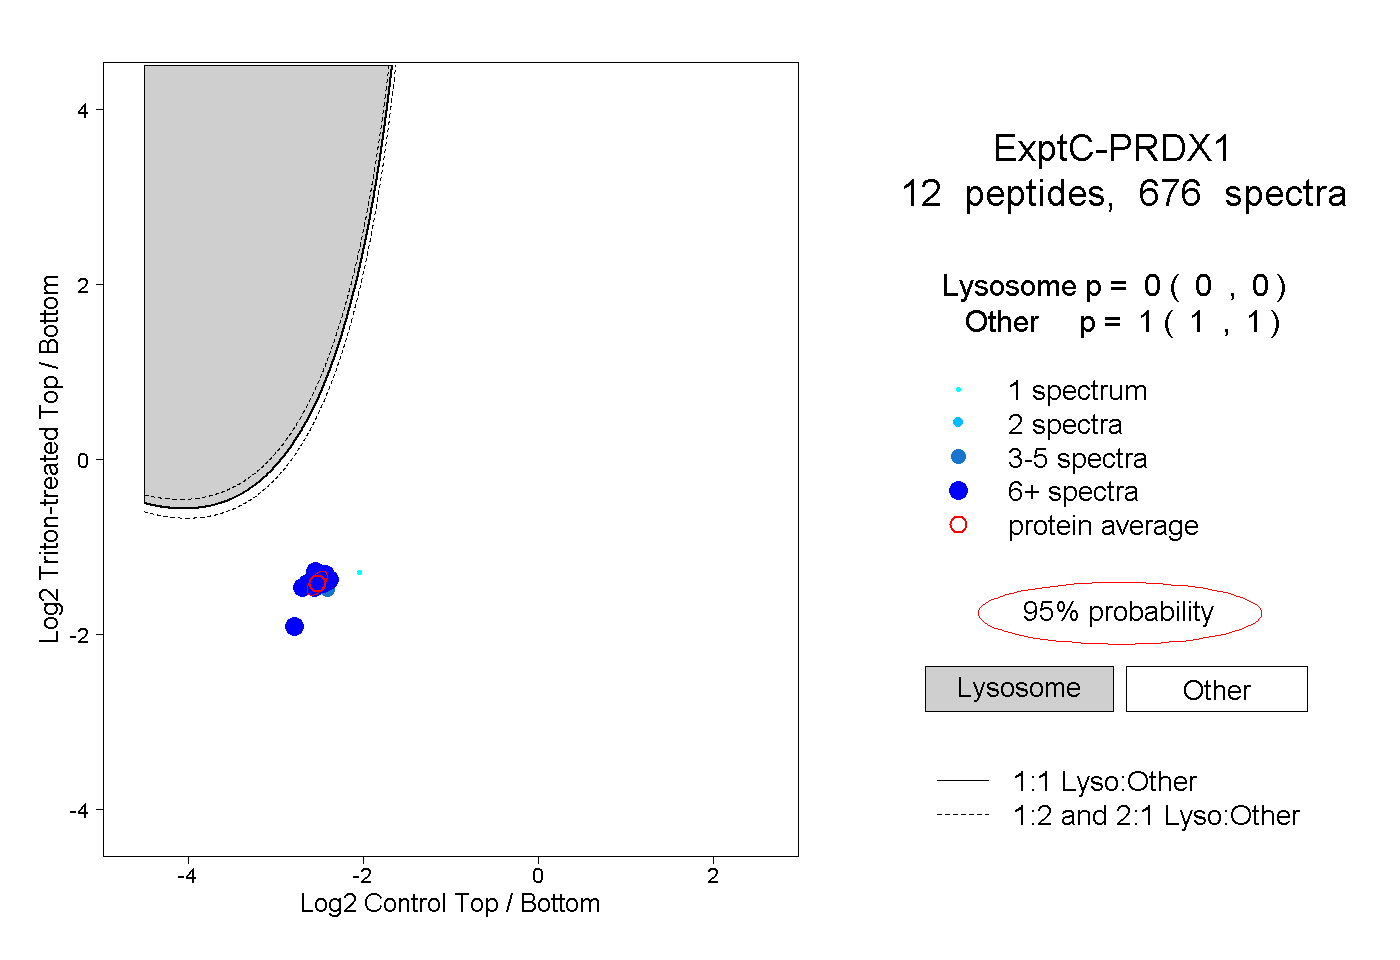 |
0.000 0.000 | 0.000 |
1.000 1.000 | 1.000 |
||||||||
| Plot | Lyso | Other | |||||||||||
| Expt D |
10 peptides |
80 spectra |
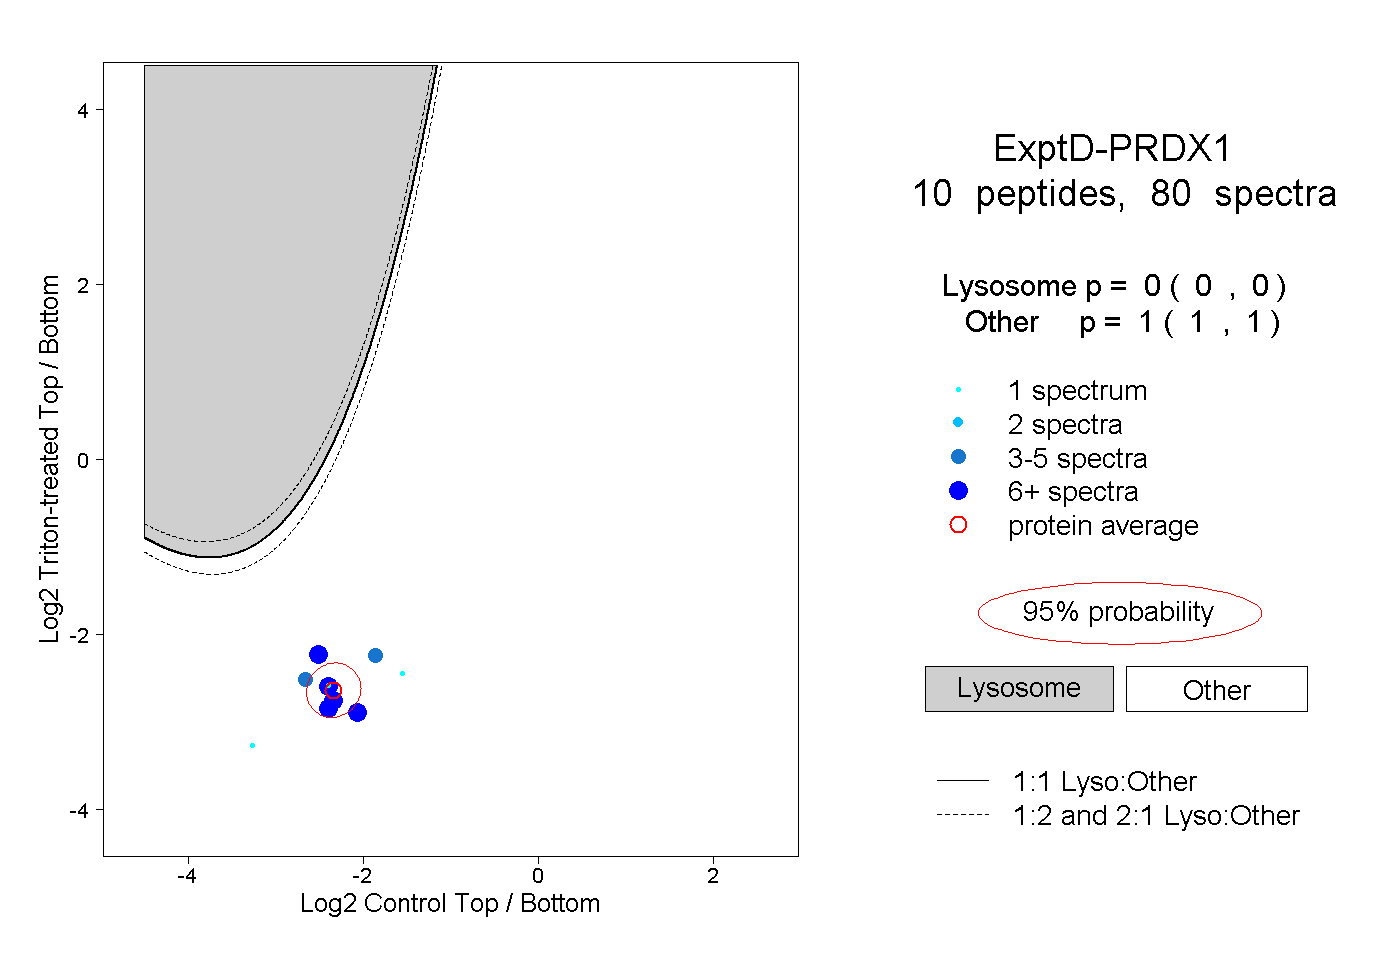 |
0.000 0.000 | 0.000 |
1.000 1.000 | 1.000 |