 1
1peptide
spectra
0.000 | 0.366
0.000 | 0.000
0.000 | 0.264
0.000 | 0.177
0.000 | 0.219
0.000 | 0.219
0.101 | 0.257
0.122 | 0.377
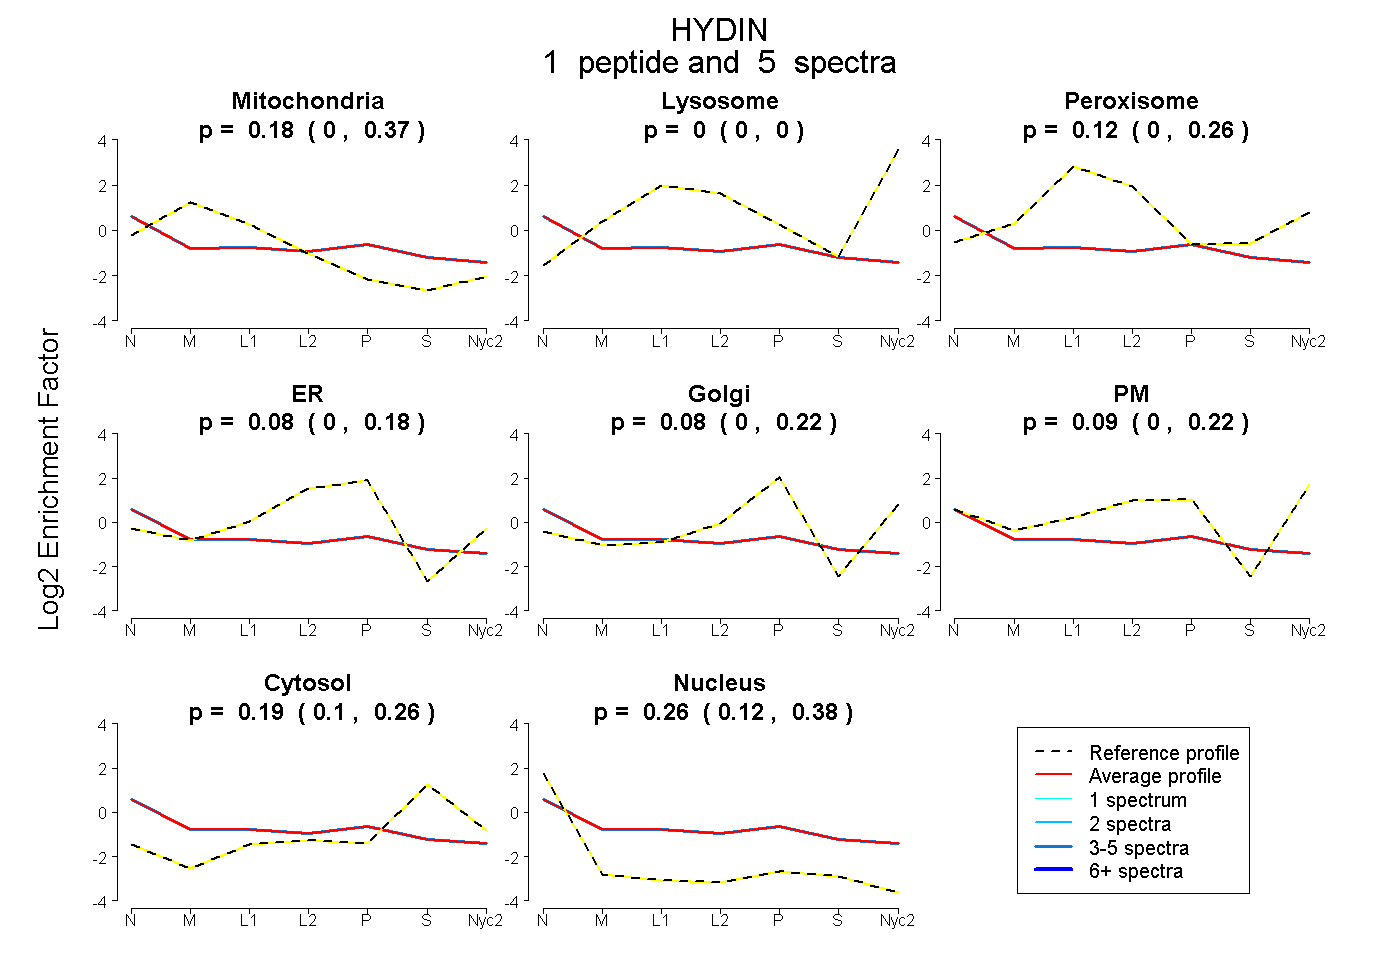
| Plot | Mito | Lyso | Perox | ER | Golgi | PM | Cytosol | Nucleus | |||||
| Expt A |
1 peptide |
5 spectra |
|
0.179 0.000 | 0.366 |
0.000 0.000 | 0.000 |
0.116 0.000 | 0.264 |
0.084 0.000 | 0.177 |
0.081 0.000 | 0.219 |
0.088 0.000 | 0.219 |
0.191 0.101 | 0.257 |
0.261 0.122 | 0.377 |
| 5 spectra, LIIHR | 0.179 | 0.000 | 0.116 | 0.084 | 0.081 | 0.088 | 0.191 | 0.261 |