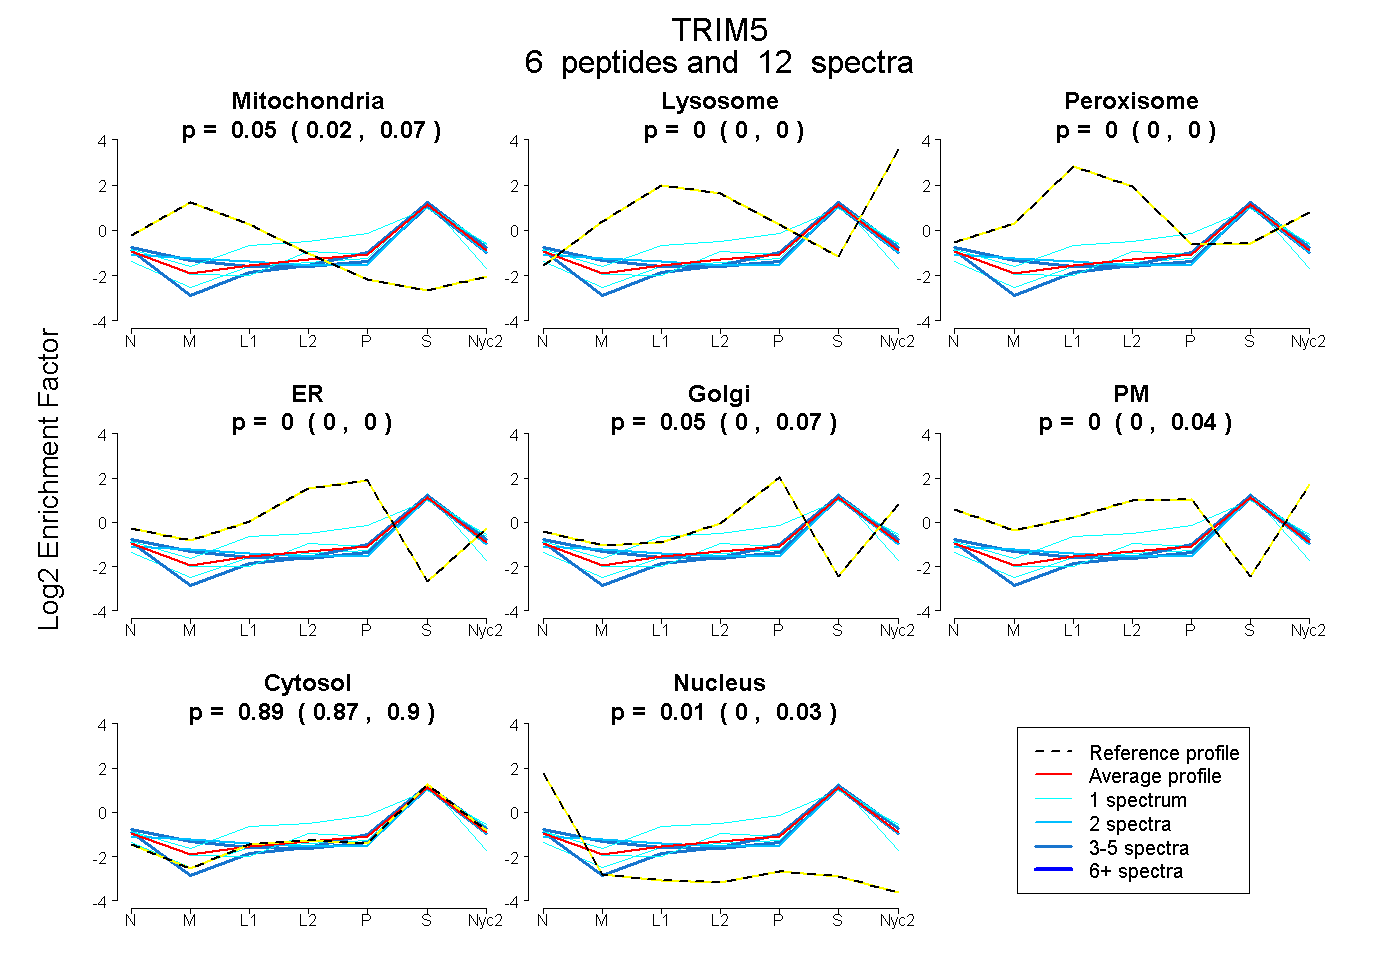
 6
6peptides
spectra
0.016 | 0.073
0.000 | 0.000
0.000 | 0.000
0.000 | 0.000
0.004 | 0.067
0.000 | 0.035
0.872 | 0.897
0.000 | 0.028
| Plot | Mito | Lyso | Perox | ER | Golgi | PM | Cytosol | Nucleus | |||||
| Expt A |
6 peptides |
12 spectra |
|
0.050 0.016 | 0.073 |
0.000 0.000 | 0.000 |
0.000 0.000 | 0.000 |
0.000 0.000 | 0.000 |
0.051 0.004 | 0.067 |
0.001 0.000 | 0.035 |
0.886 0.872 | 0.897 |
0.011 0.000 | 0.028 |
| 2 spectra, VSYLFK | 0.169 | 0.000 | 0.000 | 0.000 | 0.000 | 0.000 | 0.831 | 0.000 | ||
| 1 spectrum, SSPEEEPK | 0.000 | 0.000 | 0.000 | 0.000 | 0.025 | 0.068 | 0.889 | 0.019 | ||
| 1 spectrum, VLSCAR | 0.000 | 0.000 | 0.138 | 0.099 | 0.074 | 0.000 | 0.689 | 0.000 | ||
| 4 spectra, HVANIVQR | 0.000 | 0.000 | 0.000 | 0.000 | 0.022 | 0.000 | 0.923 | 0.055 | ||
| 3 spectra, DVENVQSEFK | 0.157 | 0.000 | 0.000 | 0.000 | 0.000 | 0.000 | 0.828 | 0.015 | ||
| 1 spectrum, DMMPICWLCER | 0.000 | 0.000 | 0.000 | 0.000 | 0.000 | 0.000 | 0.933 | 0.067 |
| Plot | Mito | Lyso or Perox | ER | Golgi | PM | Cytosol | Nucleus | ||||||
| Expt B |
1 peptide |
1 spectrum |
 |
0.000 NA | NA |
0.051 NA | NA |
0.000 NA | NA |
0.000 NA | NA |
0.201 NA | NA |
0.701 NA | NA |
0.047 NA | NA |
|||
| Plot | Lyso | Other | |||||||||||
| Expt C |
4 peptides |
7 spectra |
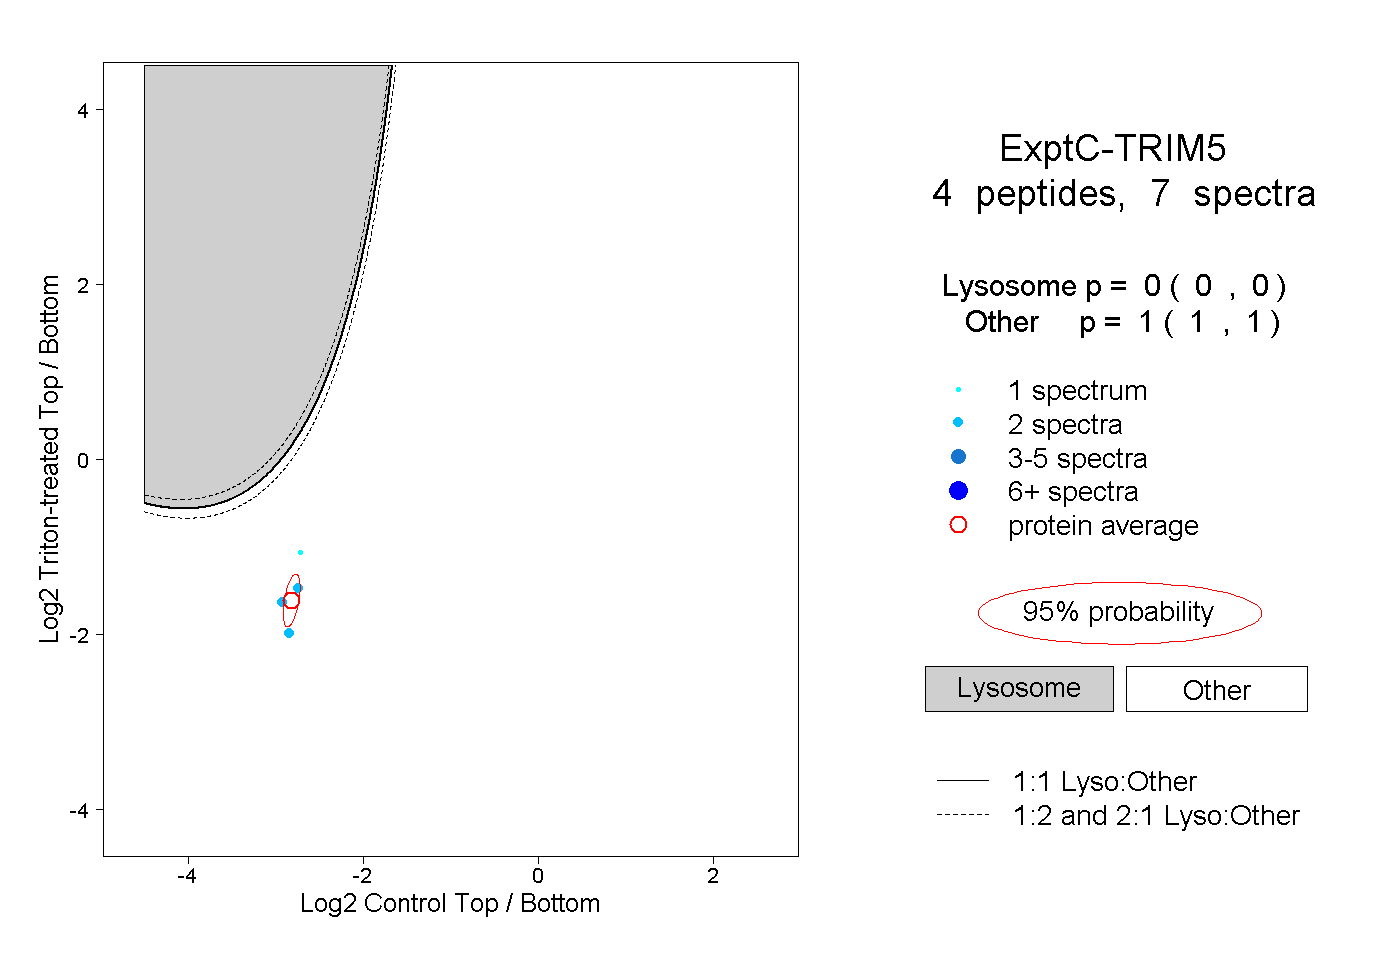 |
0.000 0.000 | 0.000 |
1.000 1.000 | 1.000 |
||||||||
| Plot | Lyso | Other | |||||||||||
| Expt D |
1 peptide |
2 spectra |
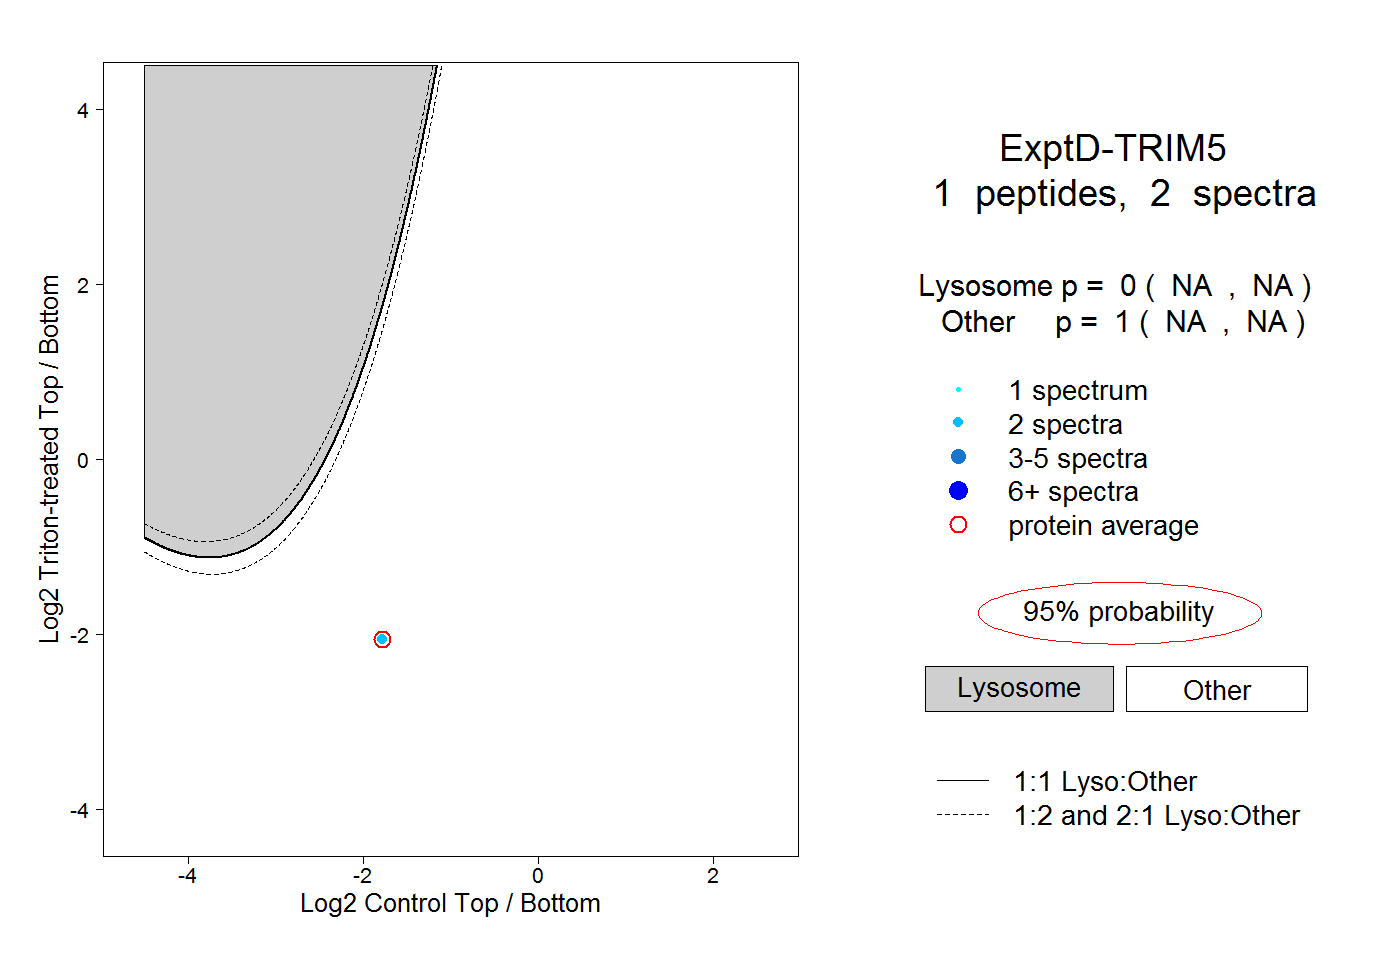 |
0.000 NA | NA |
1.000 NA | NA |