10
10peptides
spectra
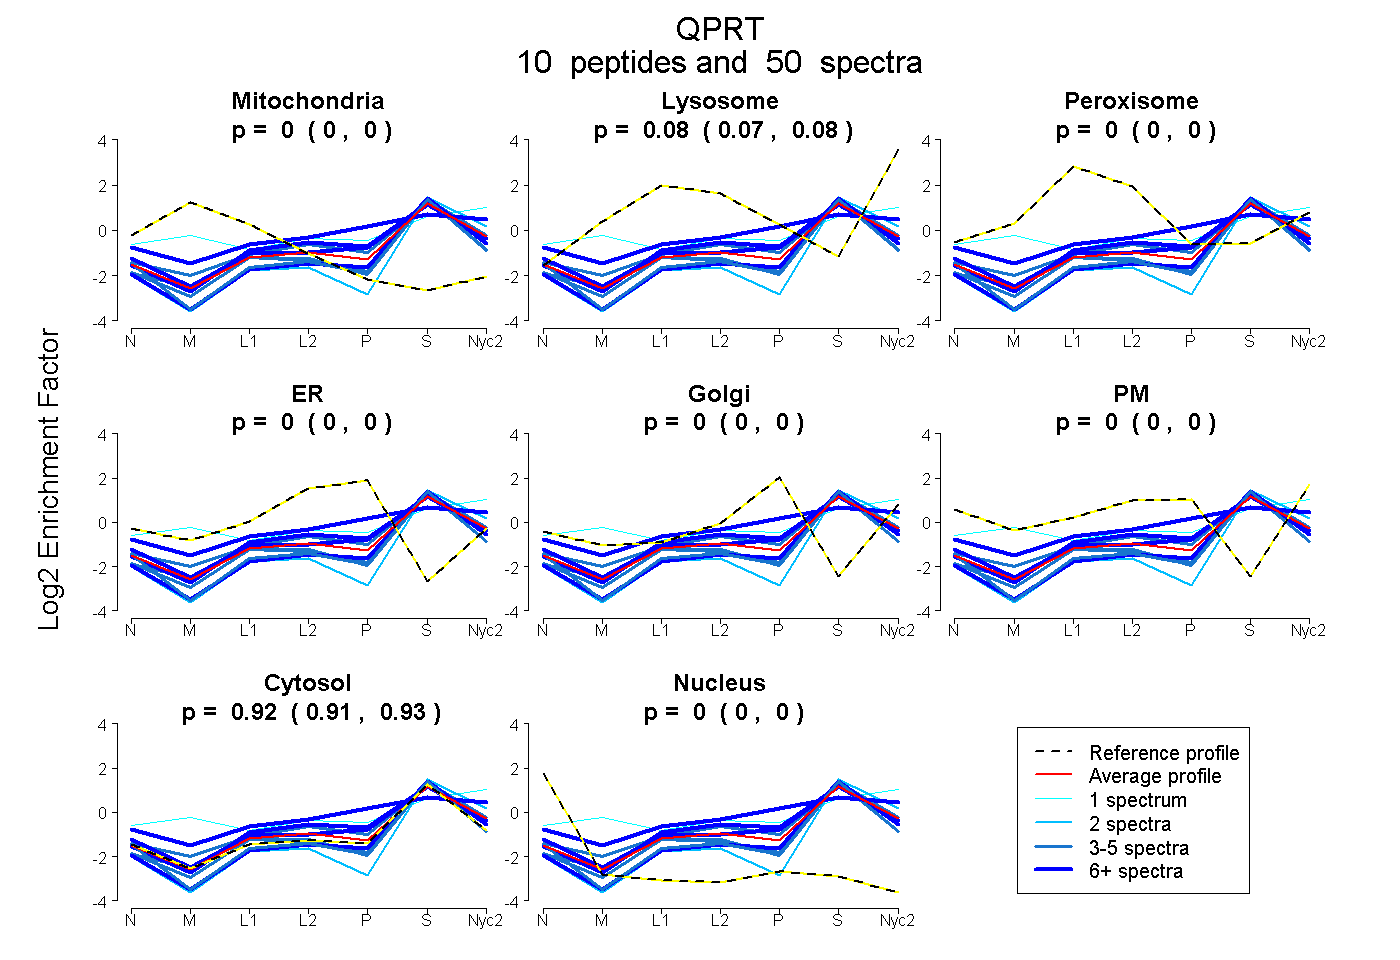
0.000 | 0.000
0.073 | 0.085
0.000 | 0.000
0.000 | 0.000
0.000 | 0.000
0.000 | 0.000
0.914 | 0.927
0.000 | 0.000
5peptides
spectra
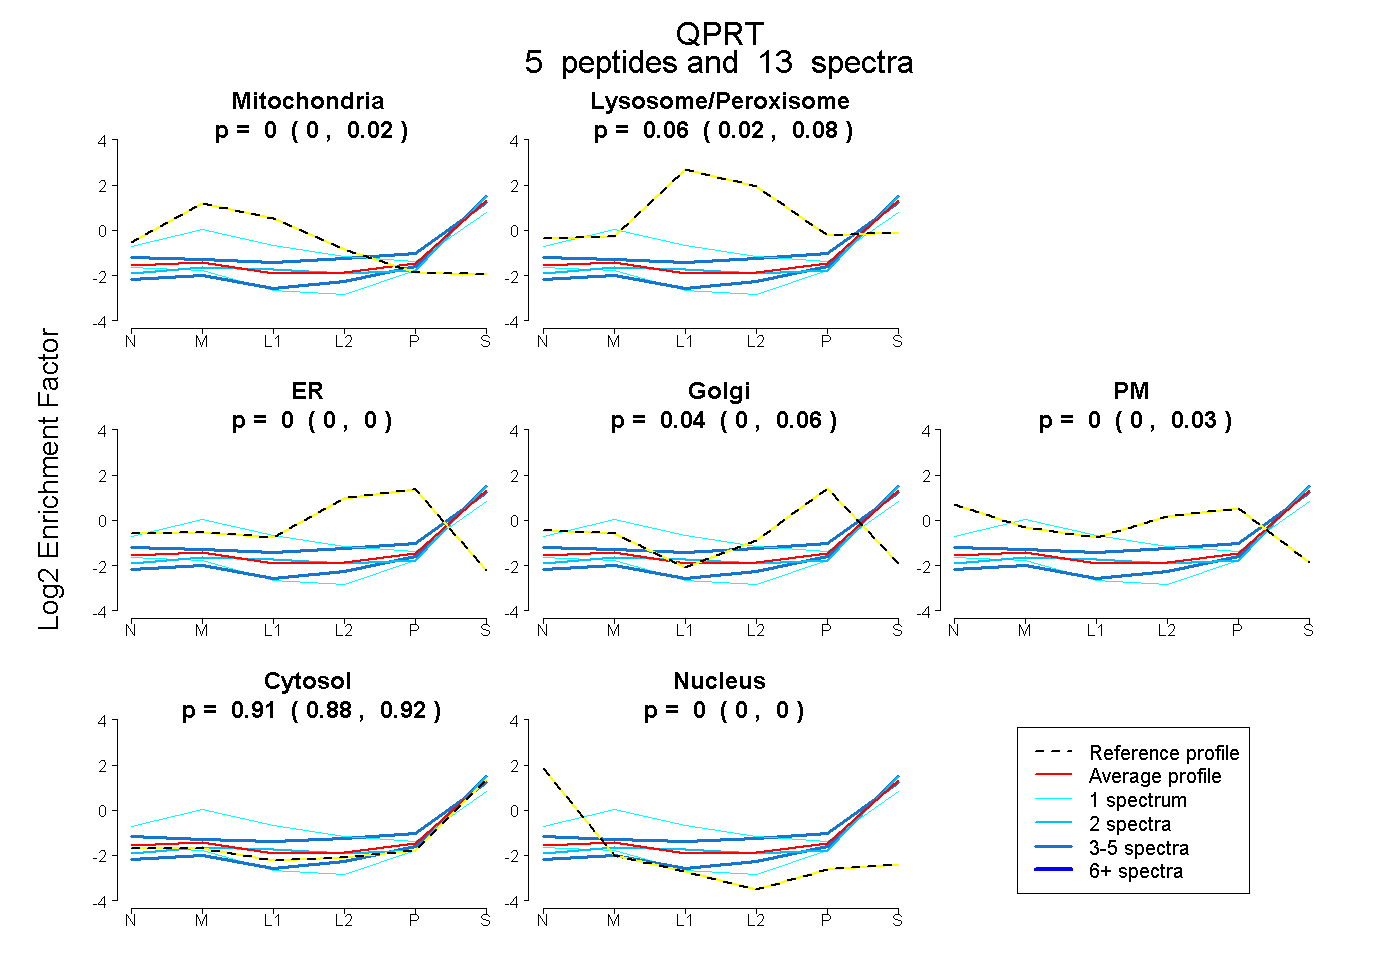
0.000 | 0.021
0.023 | 0.083
0.000 | 0.000
0.000 | 0.056
0.000 | 0.029
0.883 | 0.925
0.000 | 0.000
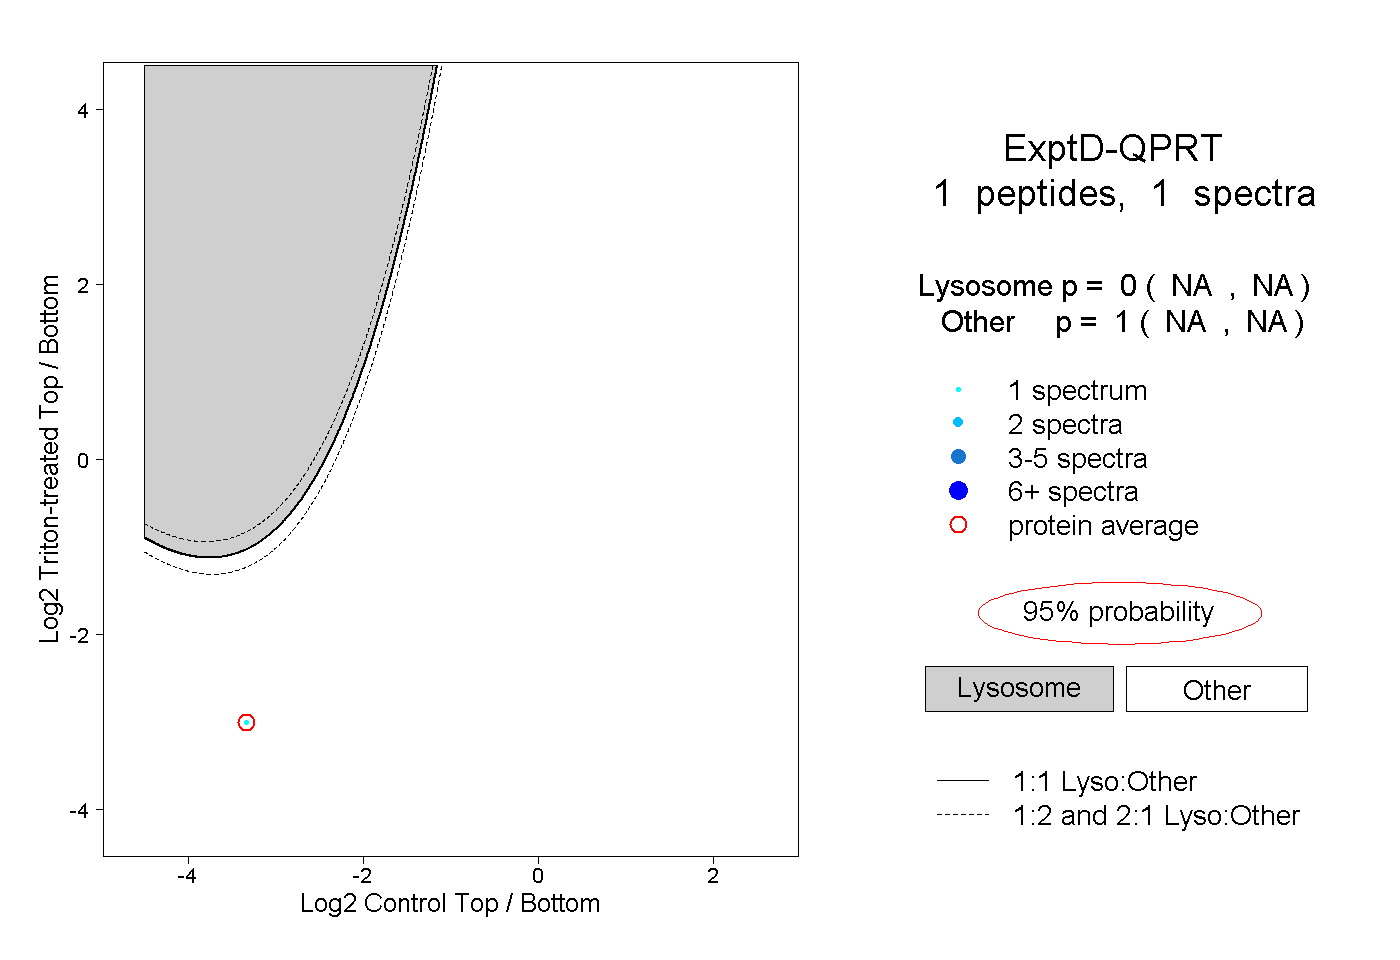
10peptides
spectra
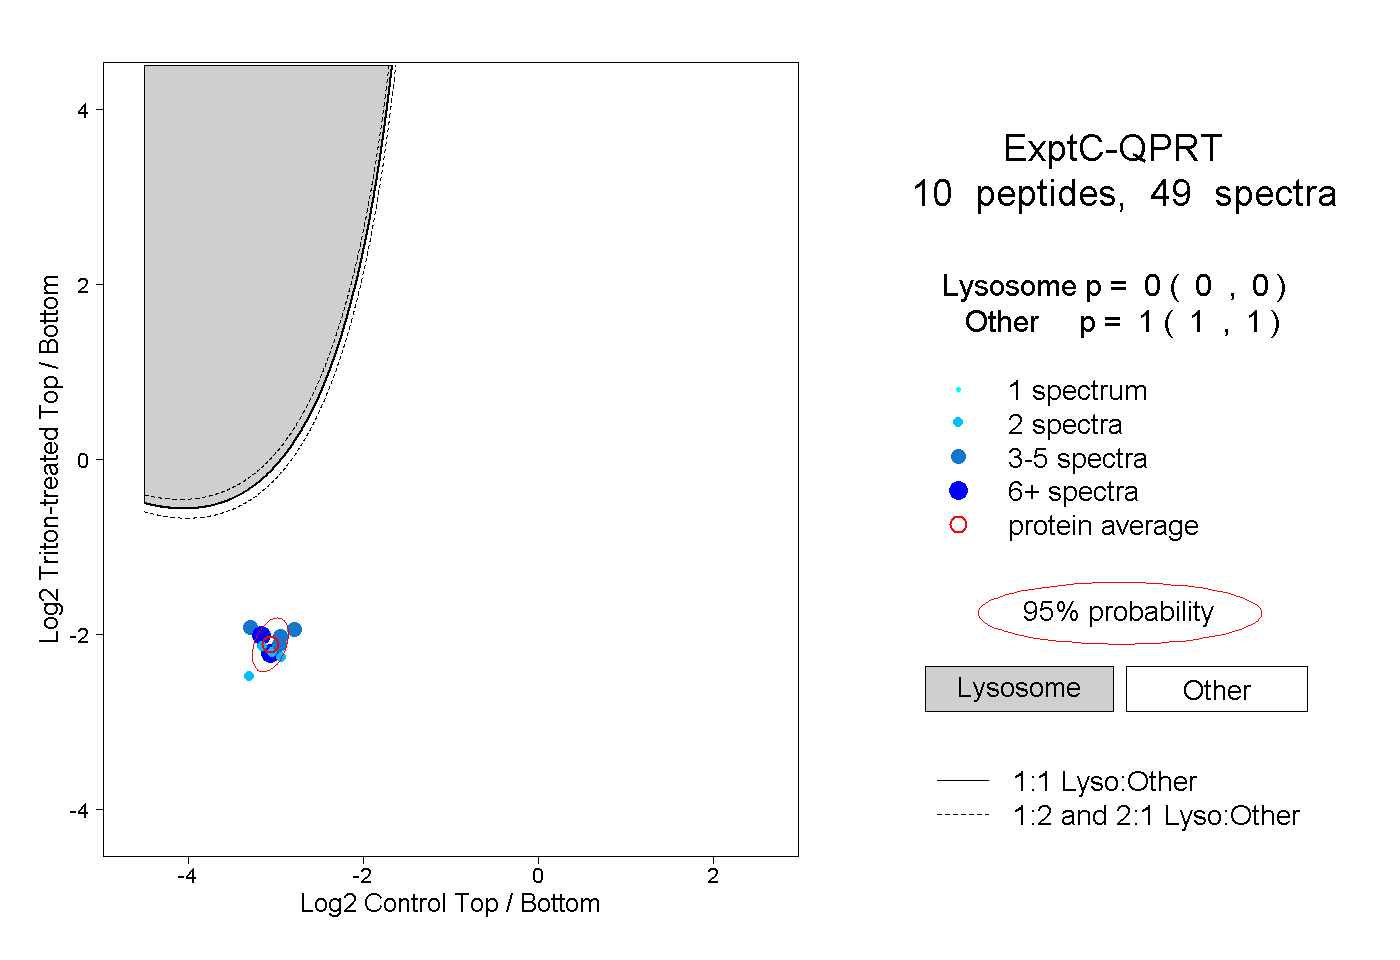
0.000 | 0.000
1.000 | 1.000