10
10peptides
spectra
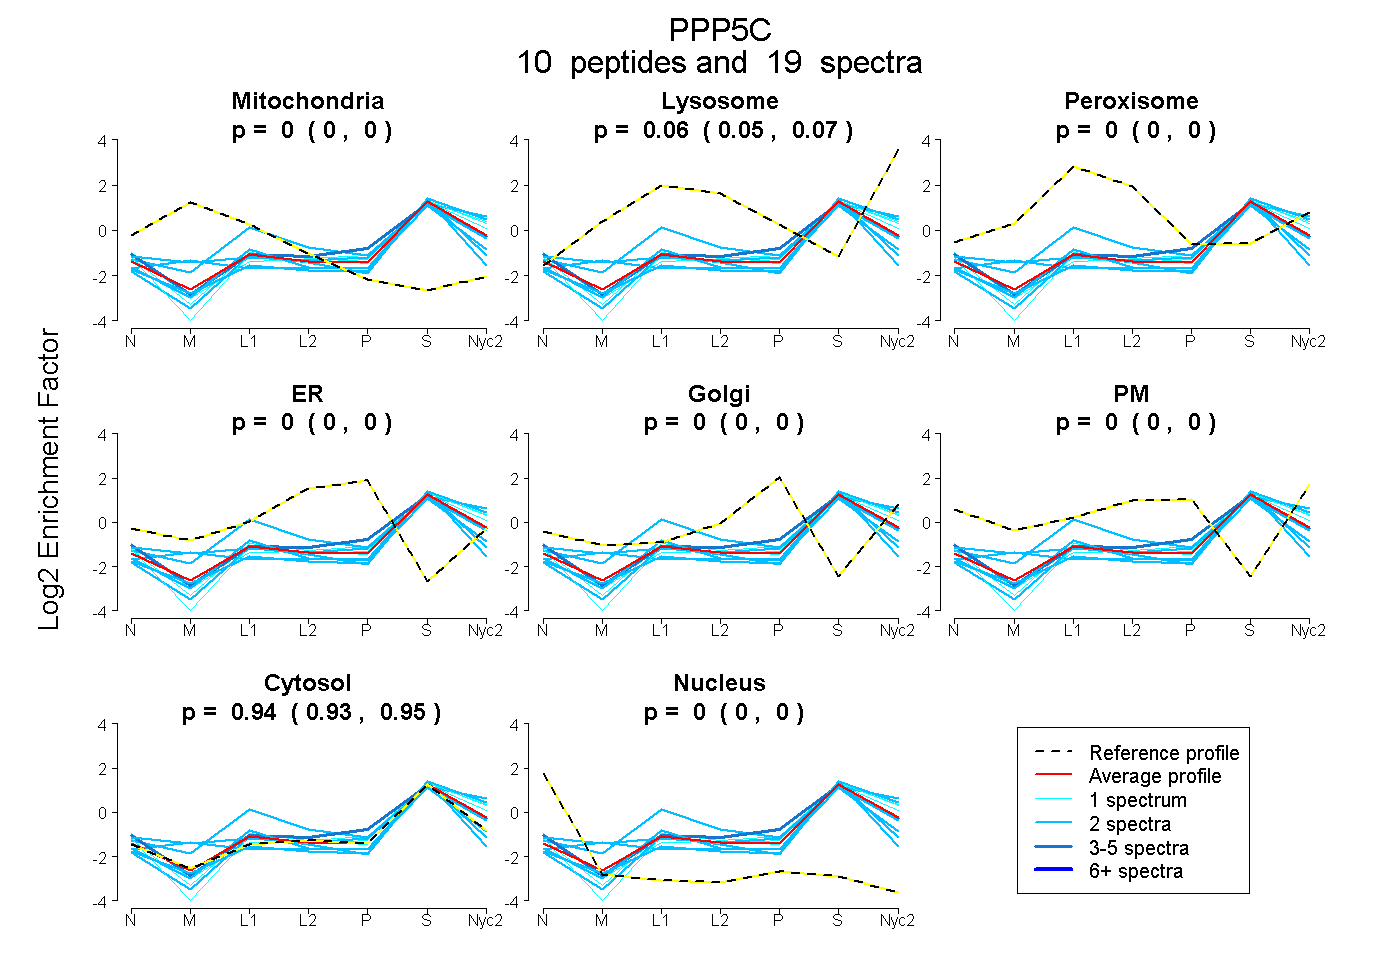
0.000 | 0.000
0.047 | 0.068
0.000 | 0.000
0.000 | 0.000
0.000 | 0.000
0.000 | 0.000
0.929 | 0.951
0.000 | 0.000
5peptides
spectra
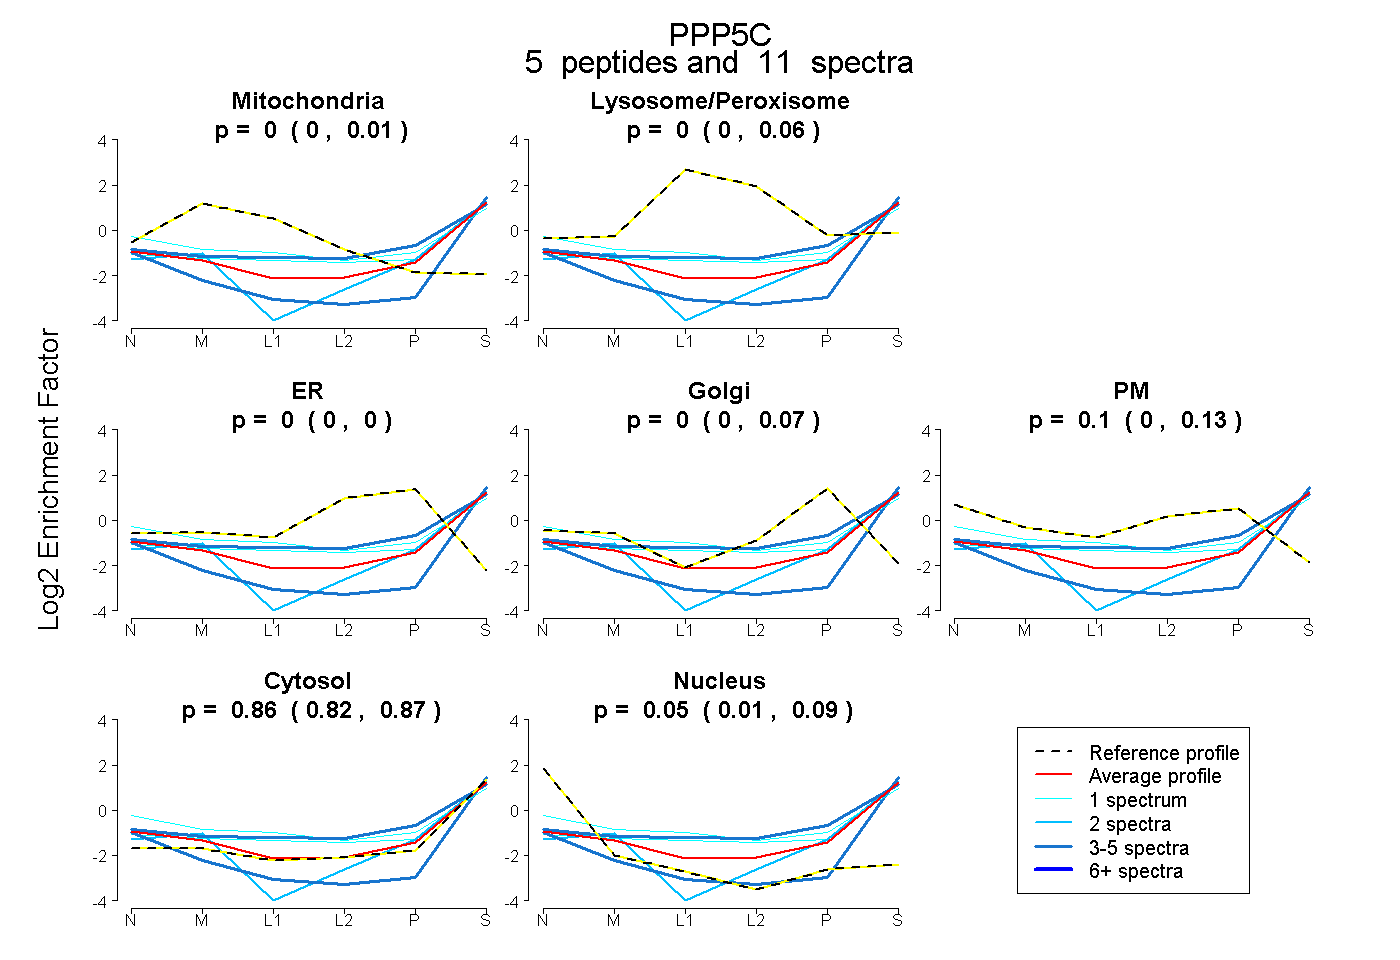
0.000 | 0.012
0.000 | 0.060
0.000 | 0.000
0.000 | 0.066
0.000 | 0.127
0.820 | 0.873
0.005 | 0.090