 10
10peptides
spectra
0.000 | 0.000
0.047 | 0.068
0.000 | 0.000
0.000 | 0.000
0.000 | 0.000
0.000 | 0.000
0.929 | 0.951
0.000 | 0.000
| Plot | Mito | Lyso | Perox | ER | Golgi | PM | Cytosol | Nucleus | |||||
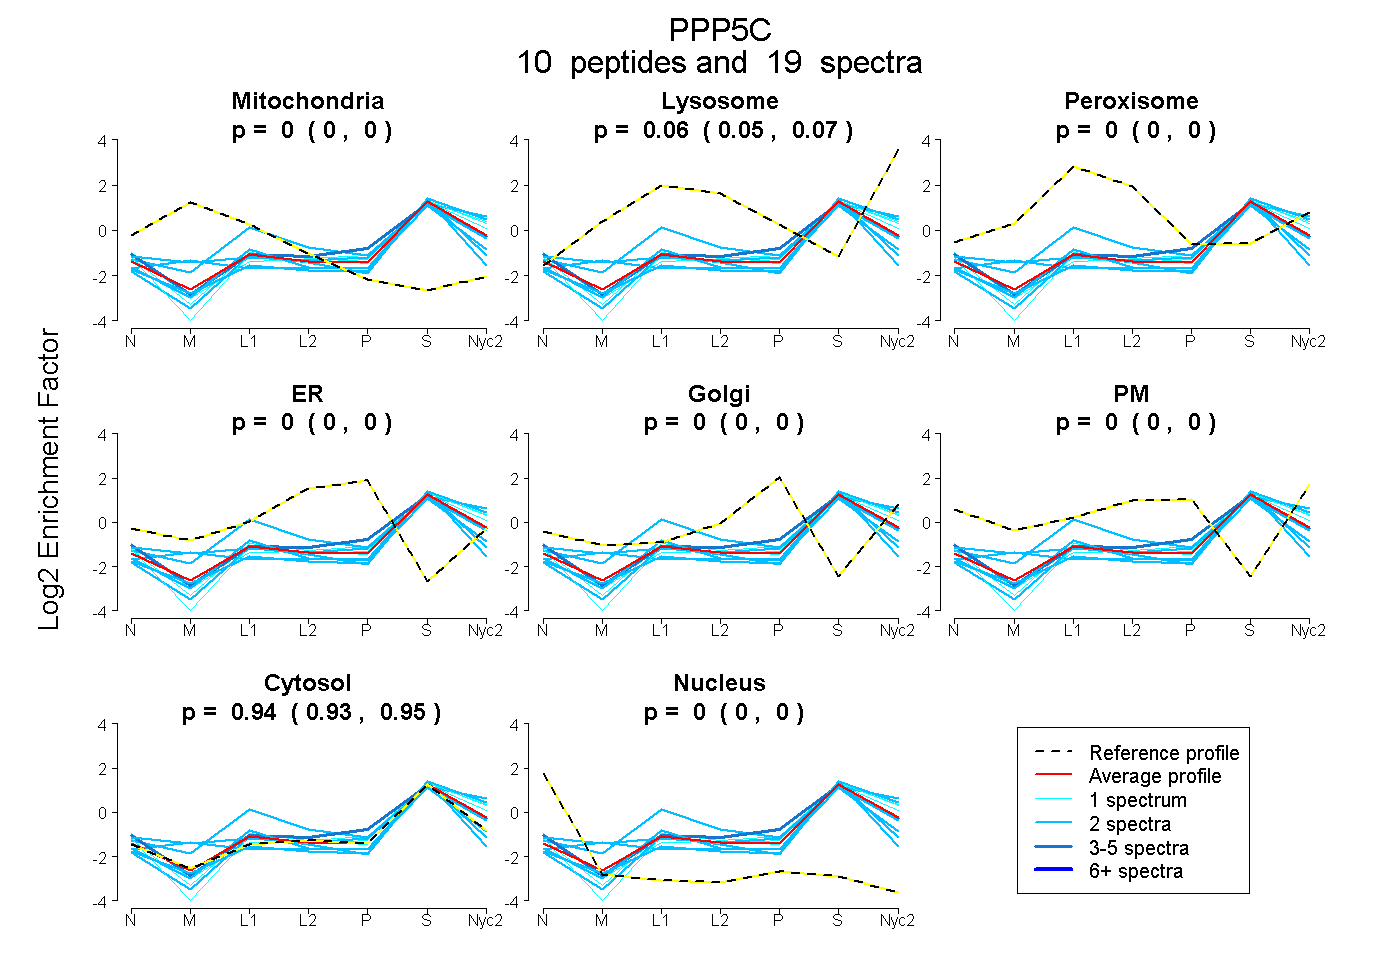
| Expt A |
10 peptides |
19 spectra |
|
0.000 0.000 | 0.000 |
0.059 0.047 | 0.068 |
0.000 0.000 | 0.000 |
0.000 0.000 | 0.000 |
0.000 0.000 | 0.000 |
0.000 0.000 | 0.000 |
0.941 0.929 | 0.951 |
0.000 0.000 | 0.000 |
| 2 spectra, TECYGYALGDATR | 0.000 | 0.000 | 0.000 | 0.000 | 0.000 | 0.000 | 0.949 | 0.051 | ||
| 2 spectra, TQANDYFK | 0.083 | 0.086 | 0.000 | 0.000 | 0.000 | 0.000 | 0.831 | 0.000 | ||
| 1 spectrum, AASNMALGK | 0.000 | 0.036 | 0.000 | 0.000 | 0.000 | 0.014 | 0.950 | 0.000 | ||
| 2 spectra, YQECSK | 0.000 | 0.000 | 0.000 | 0.000 | 0.000 | 0.000 | 1.000 | 0.000 | ||
| 2 spectra, AFLEENQLDYIIR | 0.000 | 0.042 | 0.000 | 0.000 | 0.000 | 0.000 | 0.958 | 0.000 | ||
| 4 spectra, SLAYLR | 0.000 | 0.034 | 0.000 | 0.000 | 0.050 | 0.022 | 0.895 | 0.000 | ||
| 1 spectrum, AEGYEVAHGGR | 0.000 | 0.090 | 0.000 | 0.000 | 0.000 | 0.000 | 0.910 | 0.000 | ||
| 1 spectrum, GVSCQFGPDVTK | 0.000 | 0.026 | 0.000 | 0.000 | 0.000 | 0.000 | 0.974 | 0.000 | ||
| 2 spectra, DLMQWYK | 0.000 | 0.233 | 0.060 | 0.000 | 0.000 | 0.000 | 0.707 | 0.000 | ||
| 2 spectra, DYETVVK | 0.127 | 0.000 | 0.000 | 0.000 | 0.000 | 0.000 | 0.873 | 0.000 |
| Plot | Mito | Lyso or Perox | ER | Golgi | PM | Cytosol | Nucleus | ||||||
| Expt B |
5 peptides |
11 spectra |
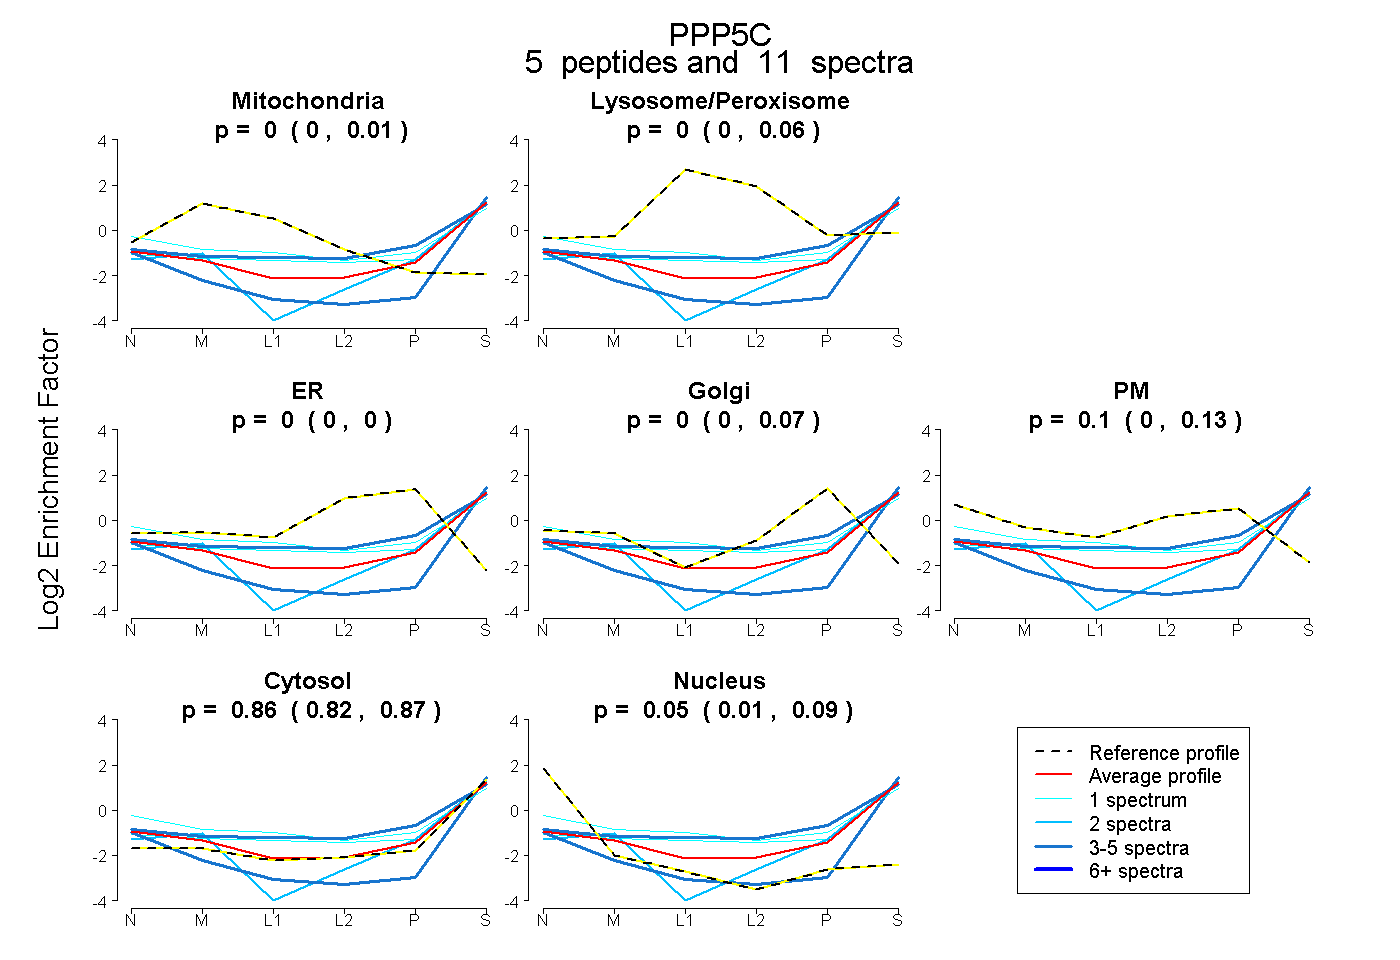 |
0.000 0.000 | 0.012 |
0.000 0.000 | 0.060 |
0.000 0.000 | 0.000 |
0.000 0.000 | 0.066 |
0.098 0.000 | 0.127 |
0.857 0.820 | 0.873 |
0.045 0.005 | 0.090 |
|||
| Plot | Lyso | Other | |||||||||||
| Expt C |
9 peptides |
22 spectra |
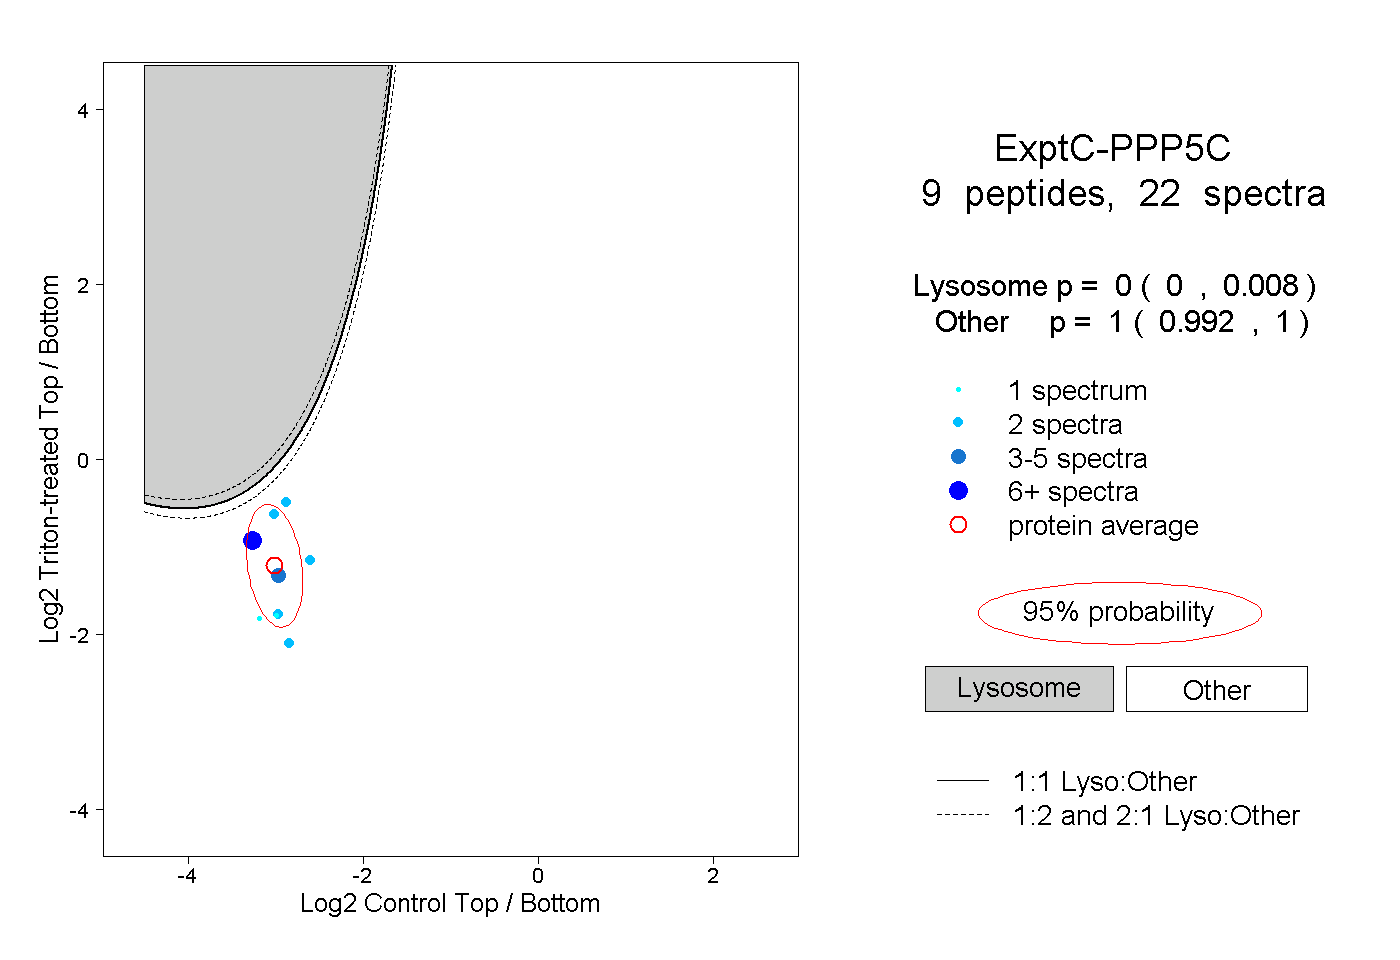 |
0.000 0.000 | 0.008 |
1.000 0.992 | 1.000 |