AKR1A1
[ENSRNOP00000023072]
Main page
| | | Plot |
Mito |
Lyso |
|
Perox |
ER |
Golgi |
PM |
Cytosol |
Nucleus |
|
| Expt A |
 20
20
peptides |
181
spectra |
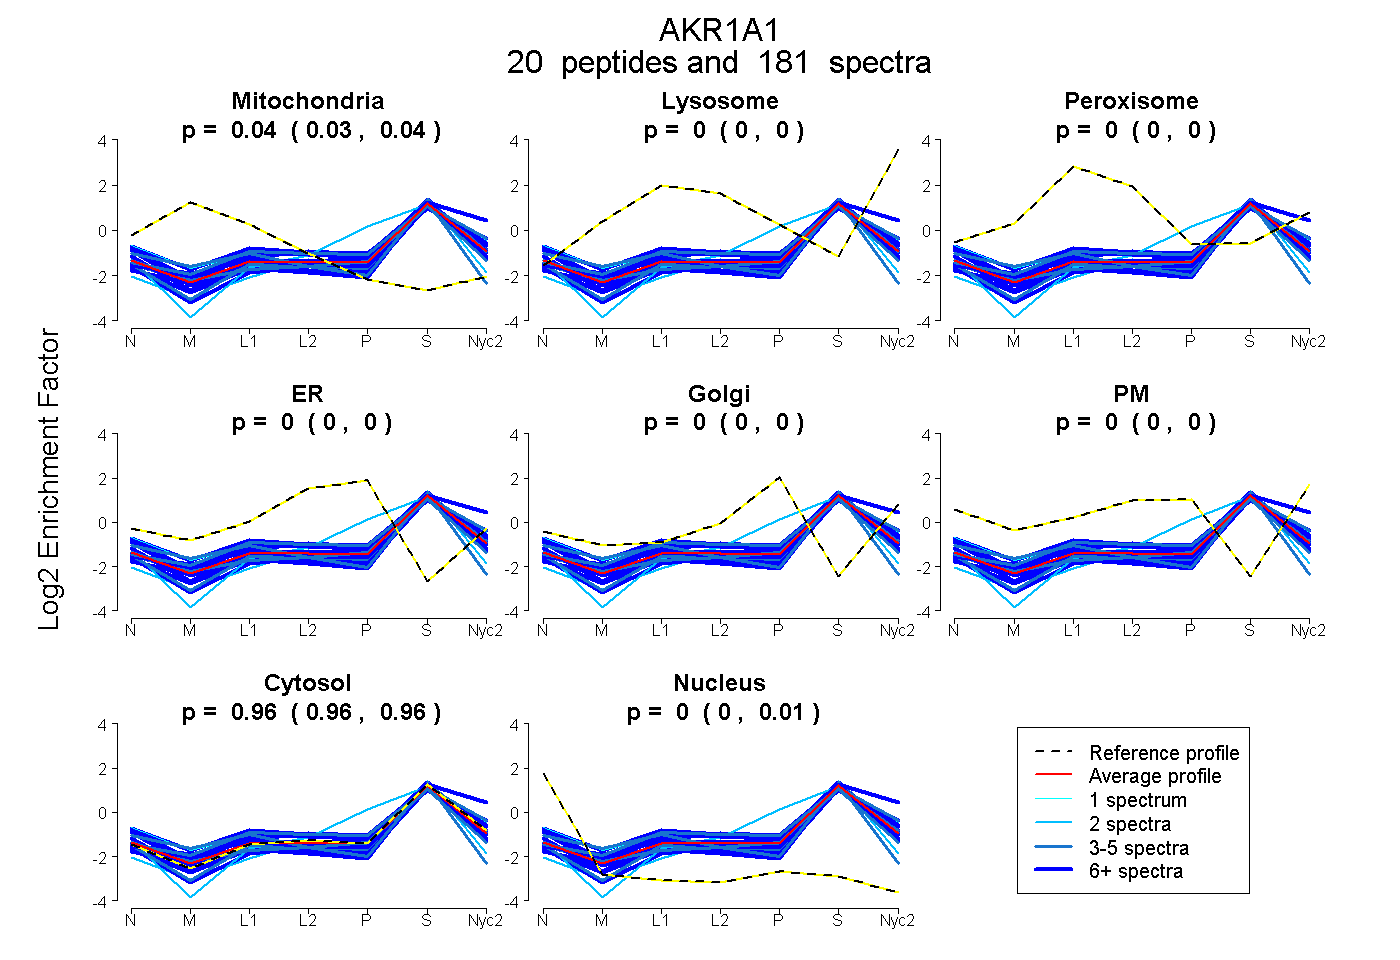 |
0.037
0.034 | 0.039 |
0.000
0.000 | 0.000 |
|
0.000
0.000 | 0.000 |
0.000
0.000 | 0.000 |
0.000
0.000 | 0.000 |
0.000
0.000 | 0.000 |
0.960
0.958 | 0.962 |
0.004
0.001 | 0.006 |
|
| | | Plot |
Mito |
|
Lyso or Perox |
|
ER |
Golgi |
PM |
Cytosol |
Nucleus |
|
| Expt B |
15
peptides |
86
spectra |
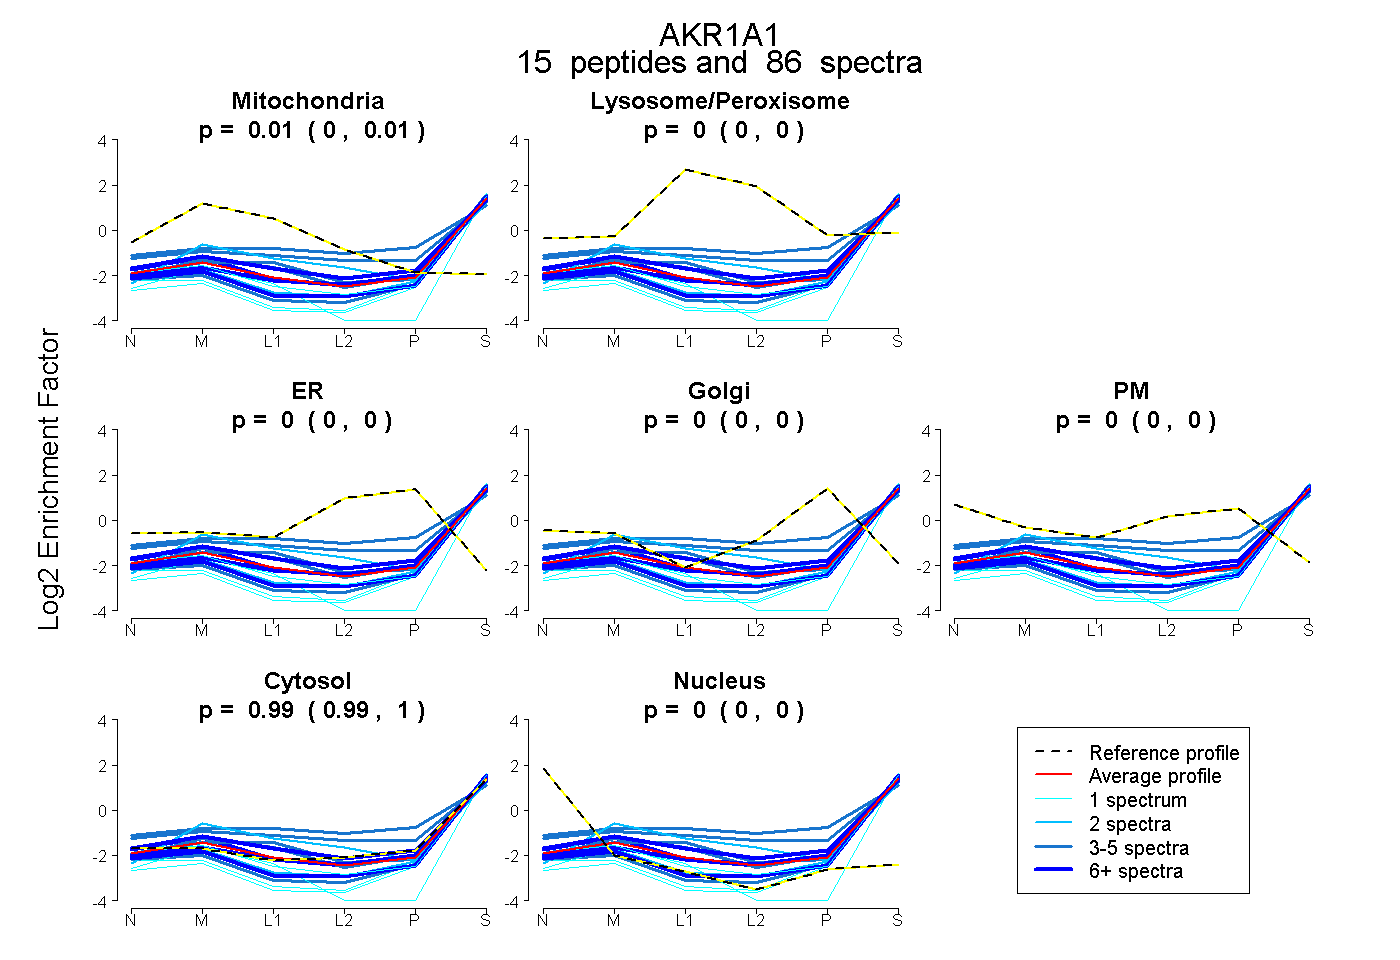 |
0.007
0.002 | 0.011 |
|
0.000
0.000 | 0.000 |
|
0.000
0.000 | 0.000 |
0.000
0.000 | 0.000 |
0.000
0.000 | 0.000 |
0.993
0.988 | 0.997 |
0.000
0.000 | 0.000 |
|
| | | Plot |
|
Lyso |
|
|
|
|
|
|
|
Other |
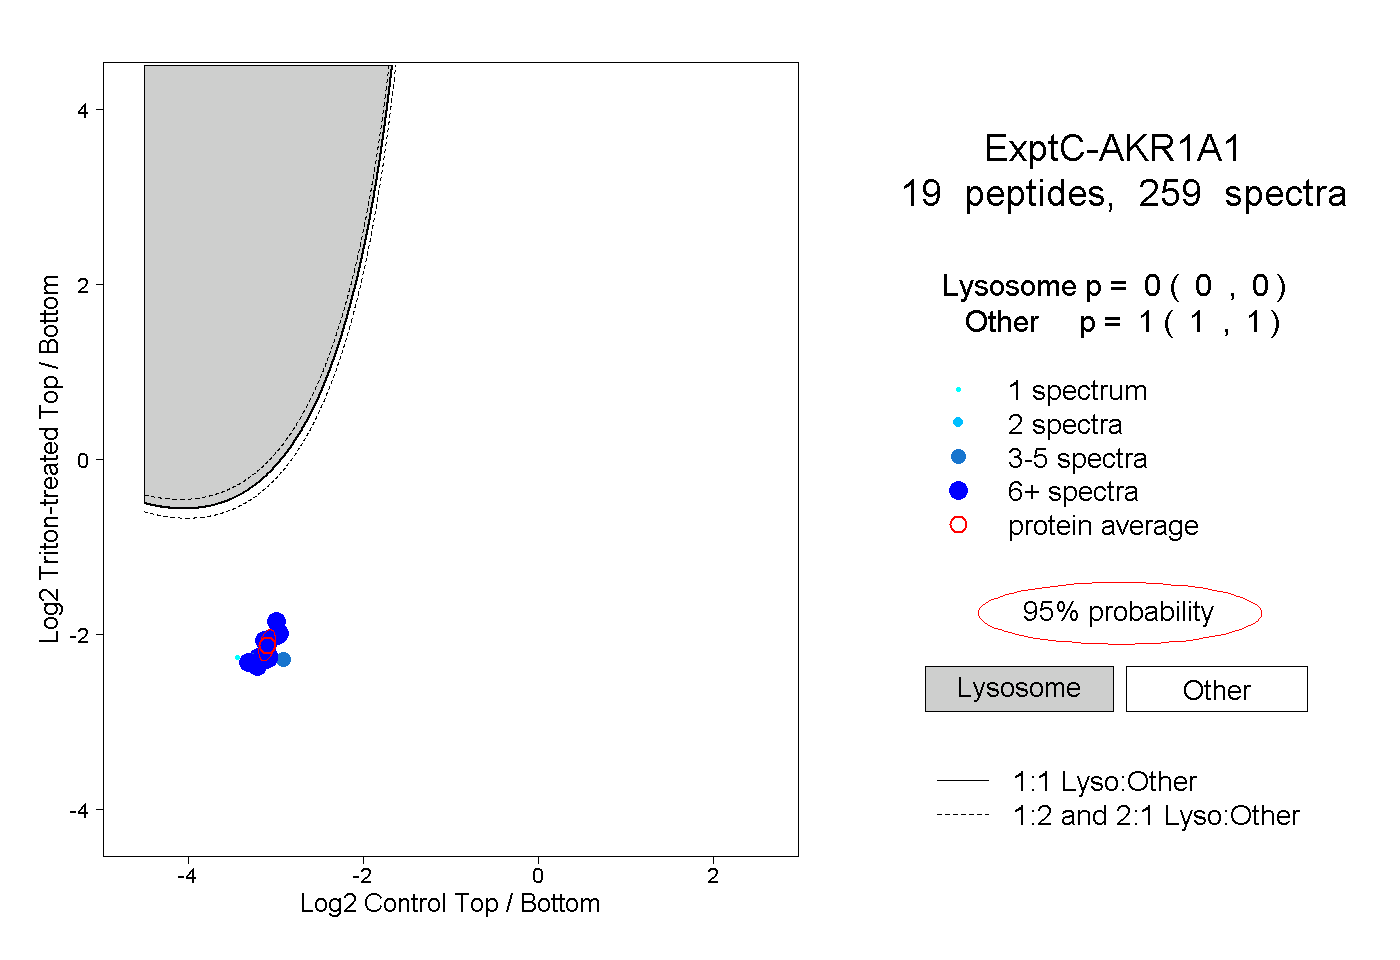
| Expt C |
19
peptides |
259
spectra |
 |
|
0.000
0.000 | 0.000 |
|
|
|
|
|
|
|
1.000
1.000 | 1.000 |
| | | Plot |
|
Lyso |
|
|
|
|
|
|
|
Other |
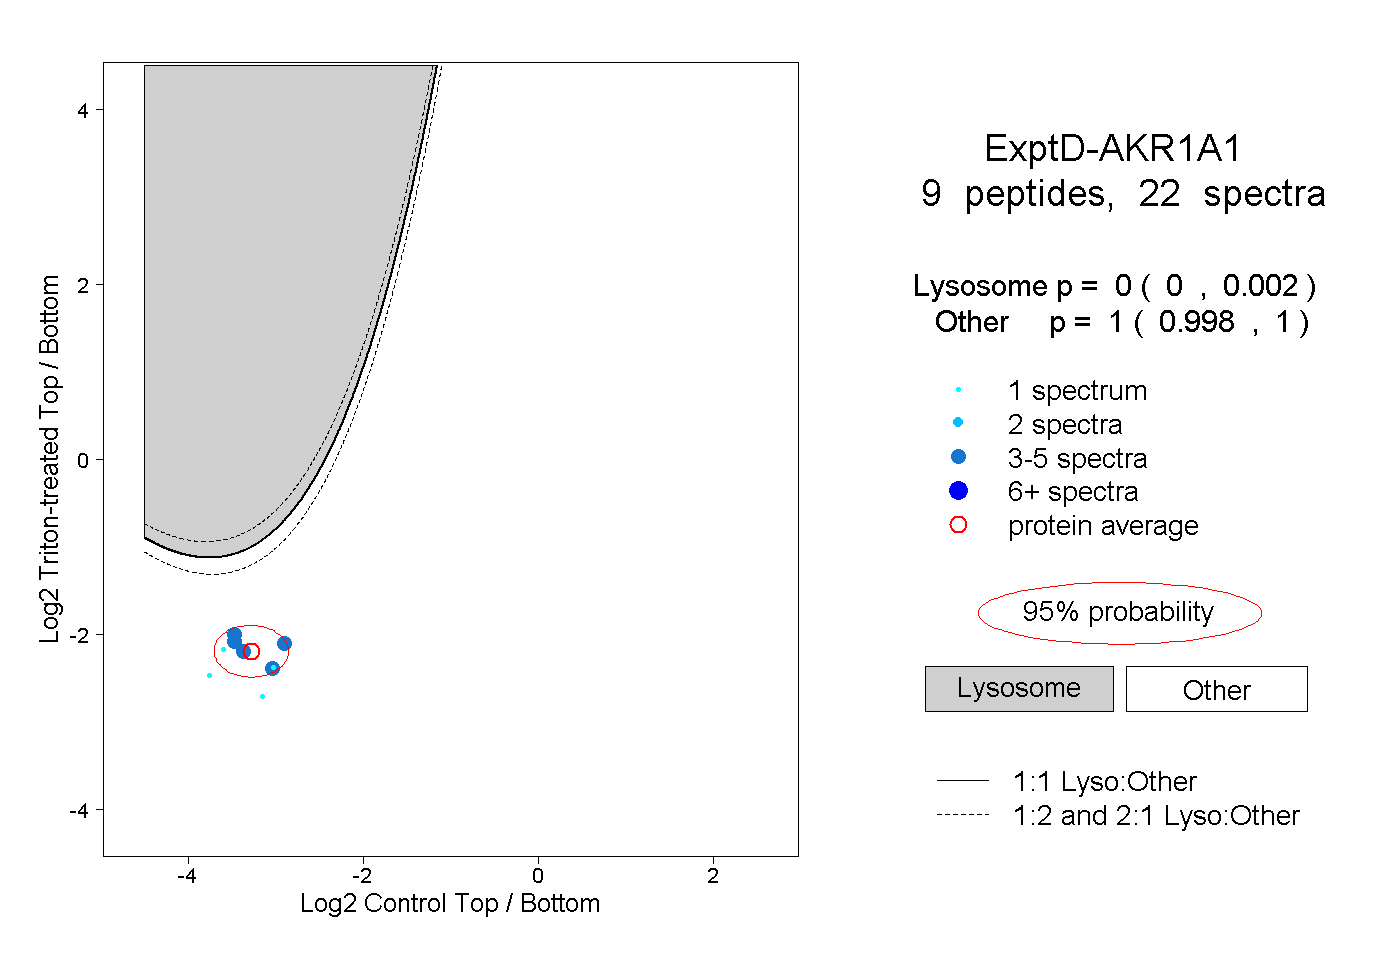
| Expt D |
9
peptides |
22
spectra |
 |
|
0.000
0.000 | 0.002 |
|
|
|
|
|
|
|
1.000
0.998 | 1.000 |
| 1 spectrum, ALEALVAK |
|
0.001 |
|
|
|
|
|
|
|
0.999 |
| 4 spectra, YALSVGYR |
|
0.002 |
|
|
|
|
|
|
|
0.998 |
| 4 spectra, EELFVTSK |
|
0.000 |
|
|
|
|
|
|
|
1.000 |
| 1 spectrum, TASSVLLHTGQK |
|
0.000 |
|
|
|
|
|
|
|
1.000 |
| 4 spectra, SEPGQVK |
|
0.001 |
|
|
|
|
|
|
|
0.999 |
| 1 spectrum, SITPSR |
|
0.000 |
|
|
|
|
|
|
|
1.000 |
| 3 spectra, SPAQILIR |
|
0.000 |
|
|
|
|
|
|
|
1.000 |
| 3 spectra, VICIPK |
|
0.000 |
|
|
|
|
|
|
|
1.000 |
| 1 spectrum, ALGLSNFSSR |
|
0.000 |
|
|
|
|
|
|
|
1.000 |