20
20peptides
spectra
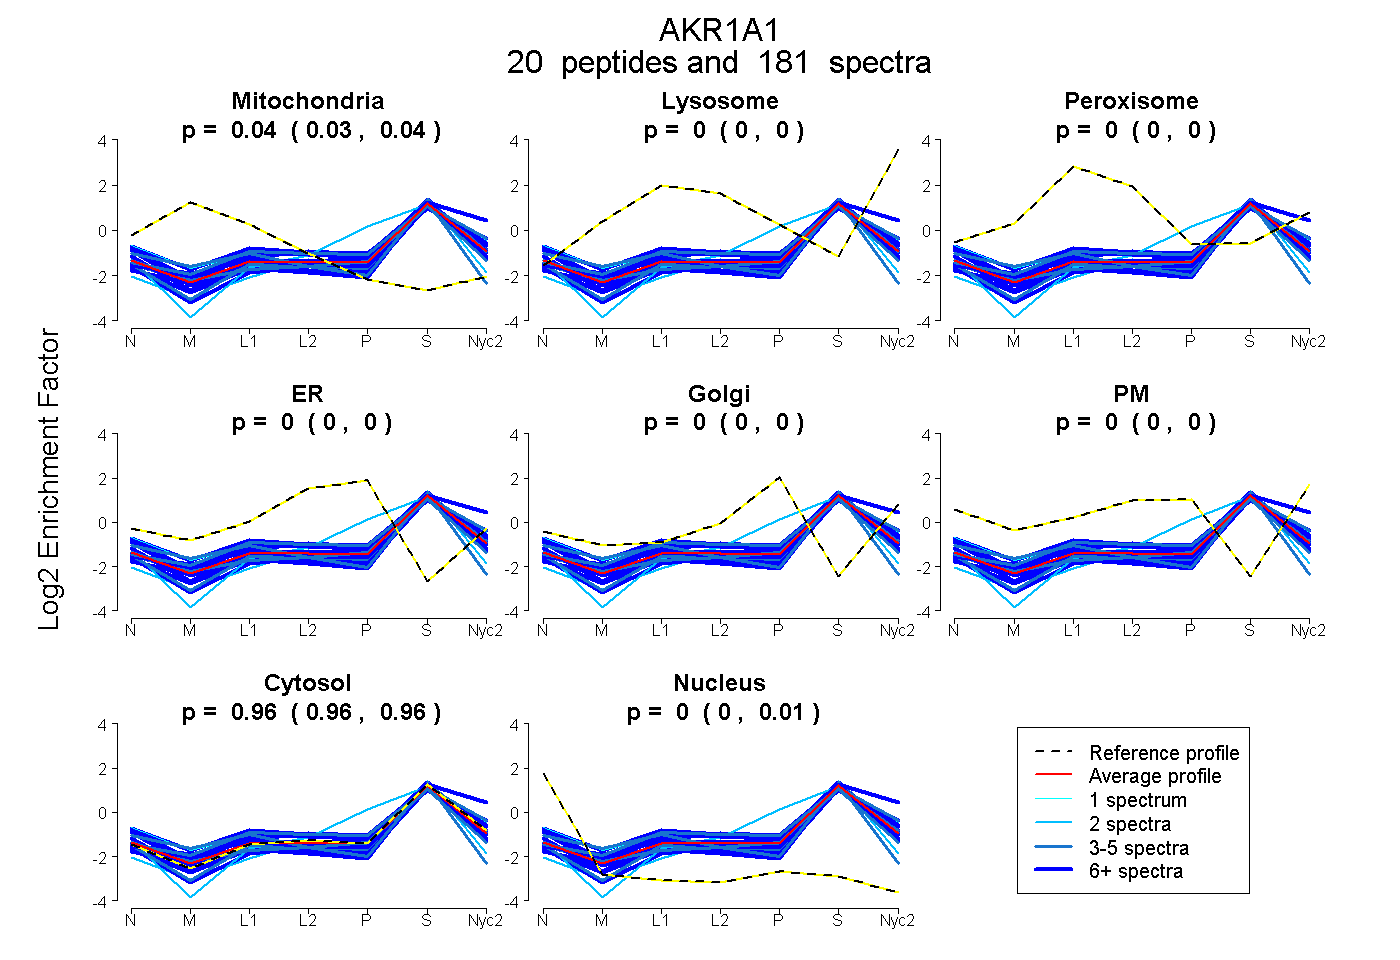
0.034 | 0.039
0.000 | 0.000
0.000 | 0.000
0.000 | 0.000
0.000 | 0.000
0.000 | 0.000
0.958 | 0.962
0.001 | 0.006
15peptides
spectra
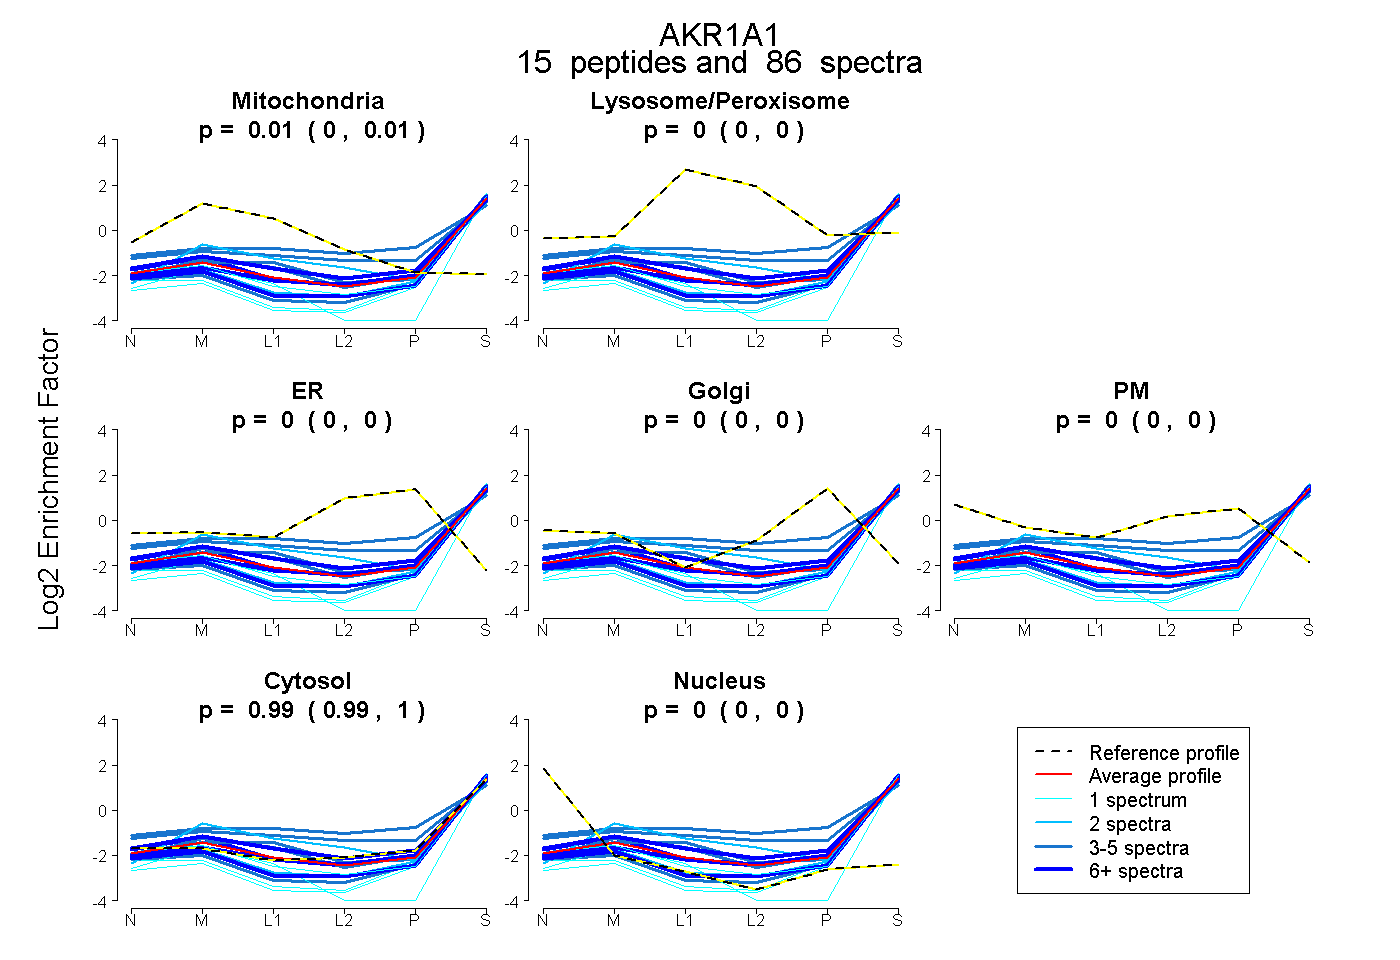
0.002 | 0.011
0.000 | 0.000
0.000 | 0.000
0.000 | 0.000
0.000 | 0.000
0.988 | 0.997
0.000 | 0.000
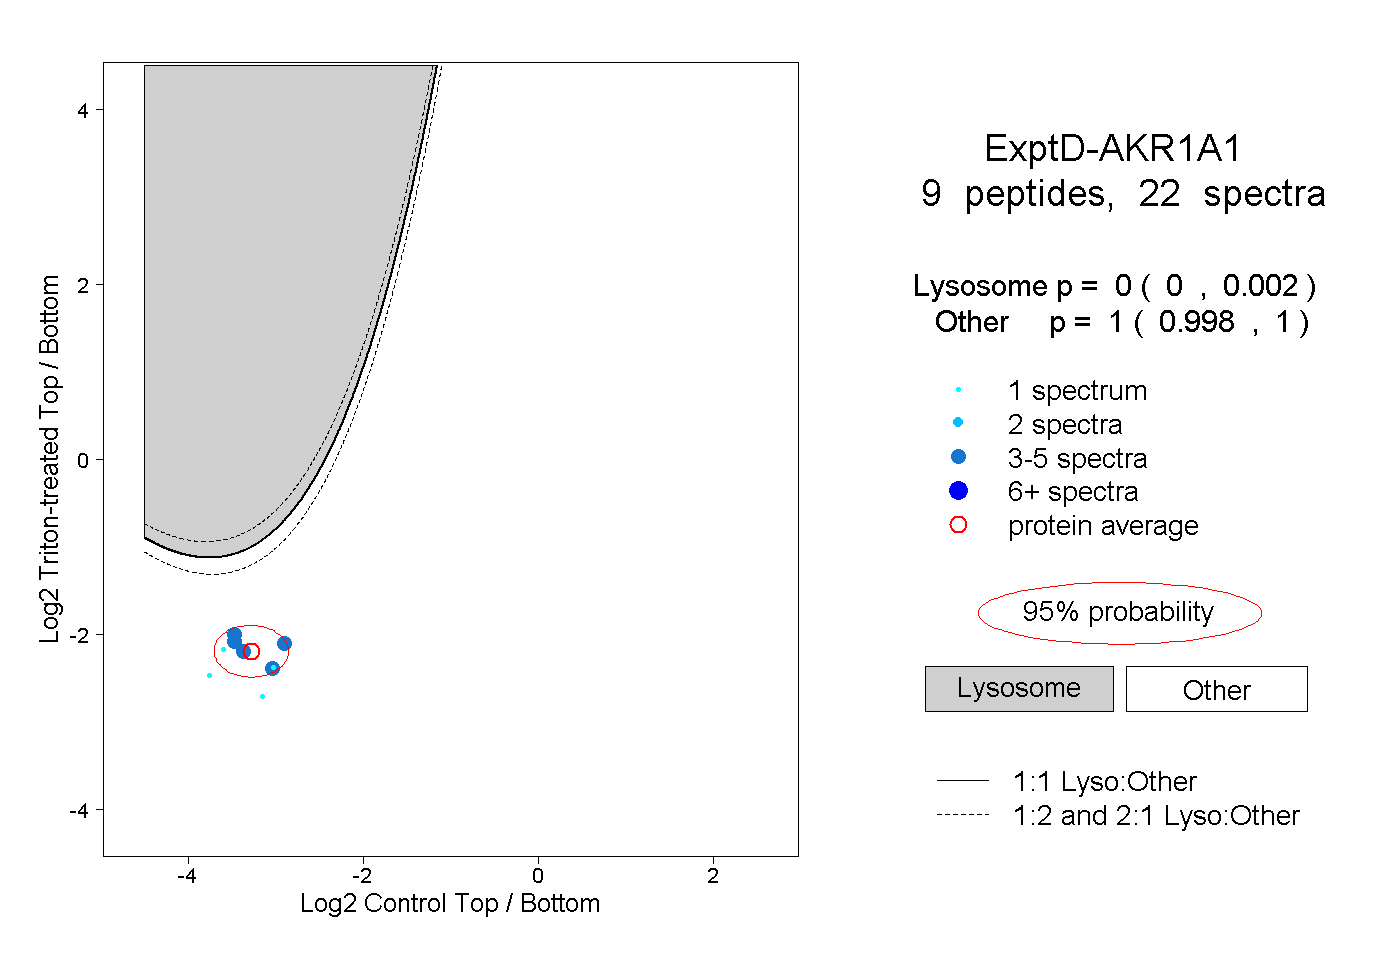
19peptides
spectra
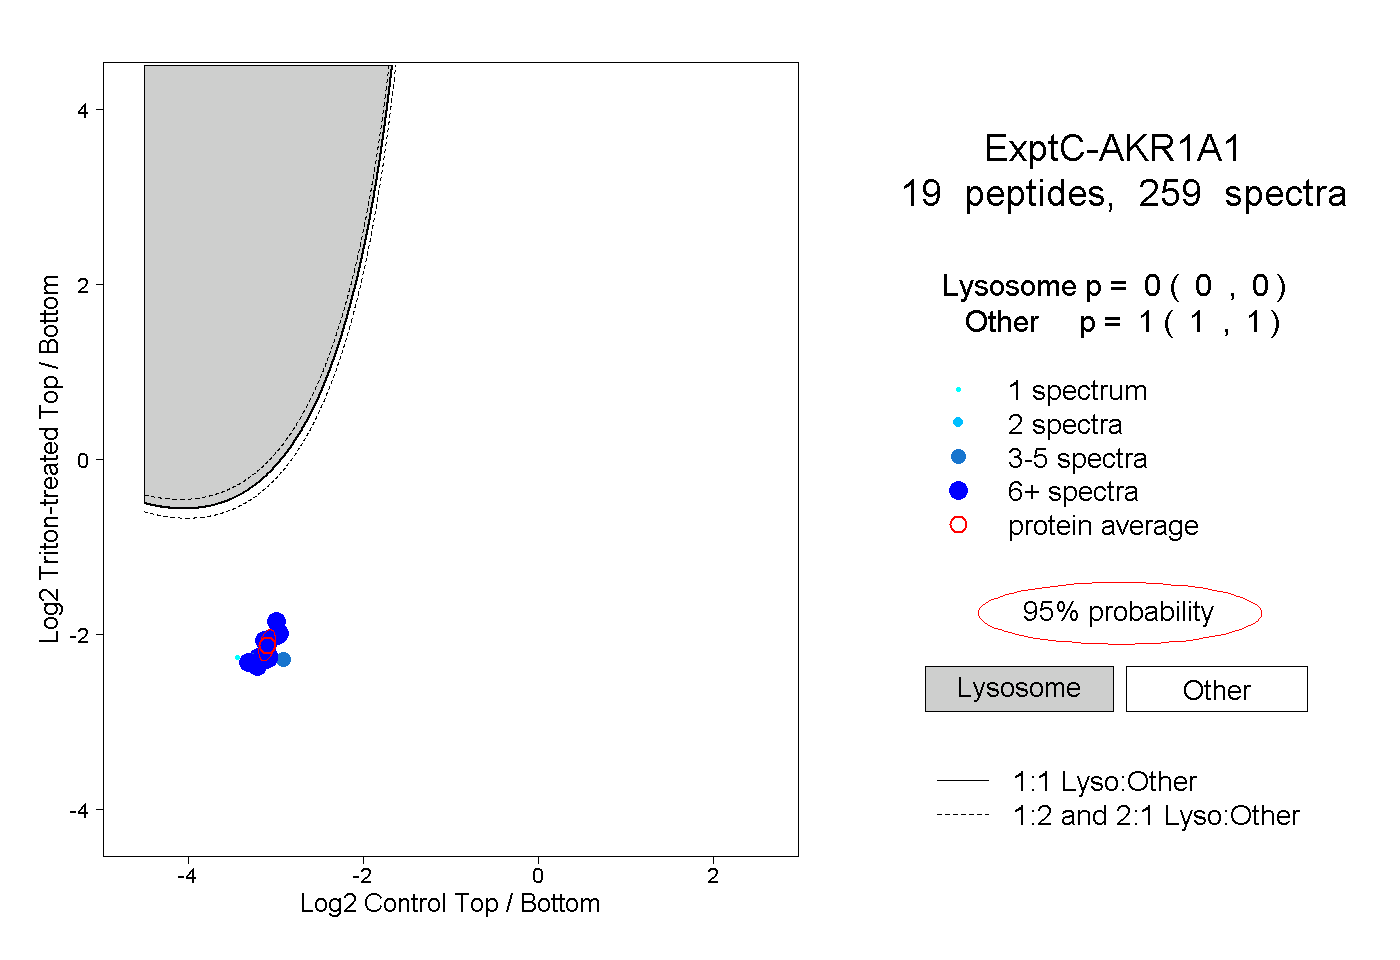
0.000 | 0.000
1.000 | 1.000