 2
2peptides
spectra
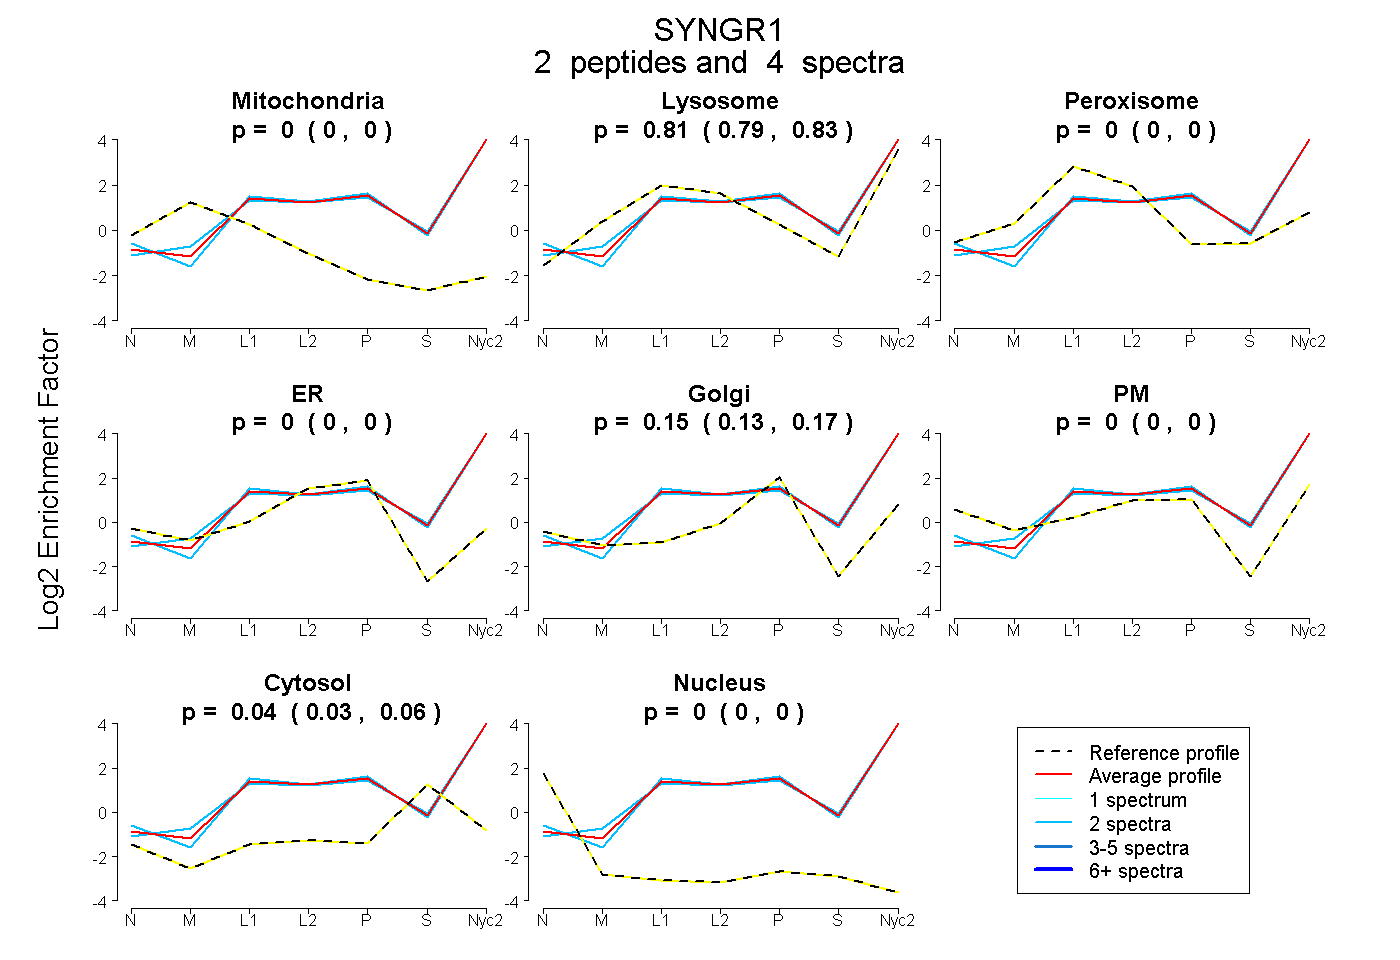
0.000 | 0.000
0.788 | 0.826
0.000 | 0.000
0.000 | 0.000
0.129 | 0.165
0.000 | 0.000
0.025 | 0.056
0.000 | 0.000
2peptides
spectra
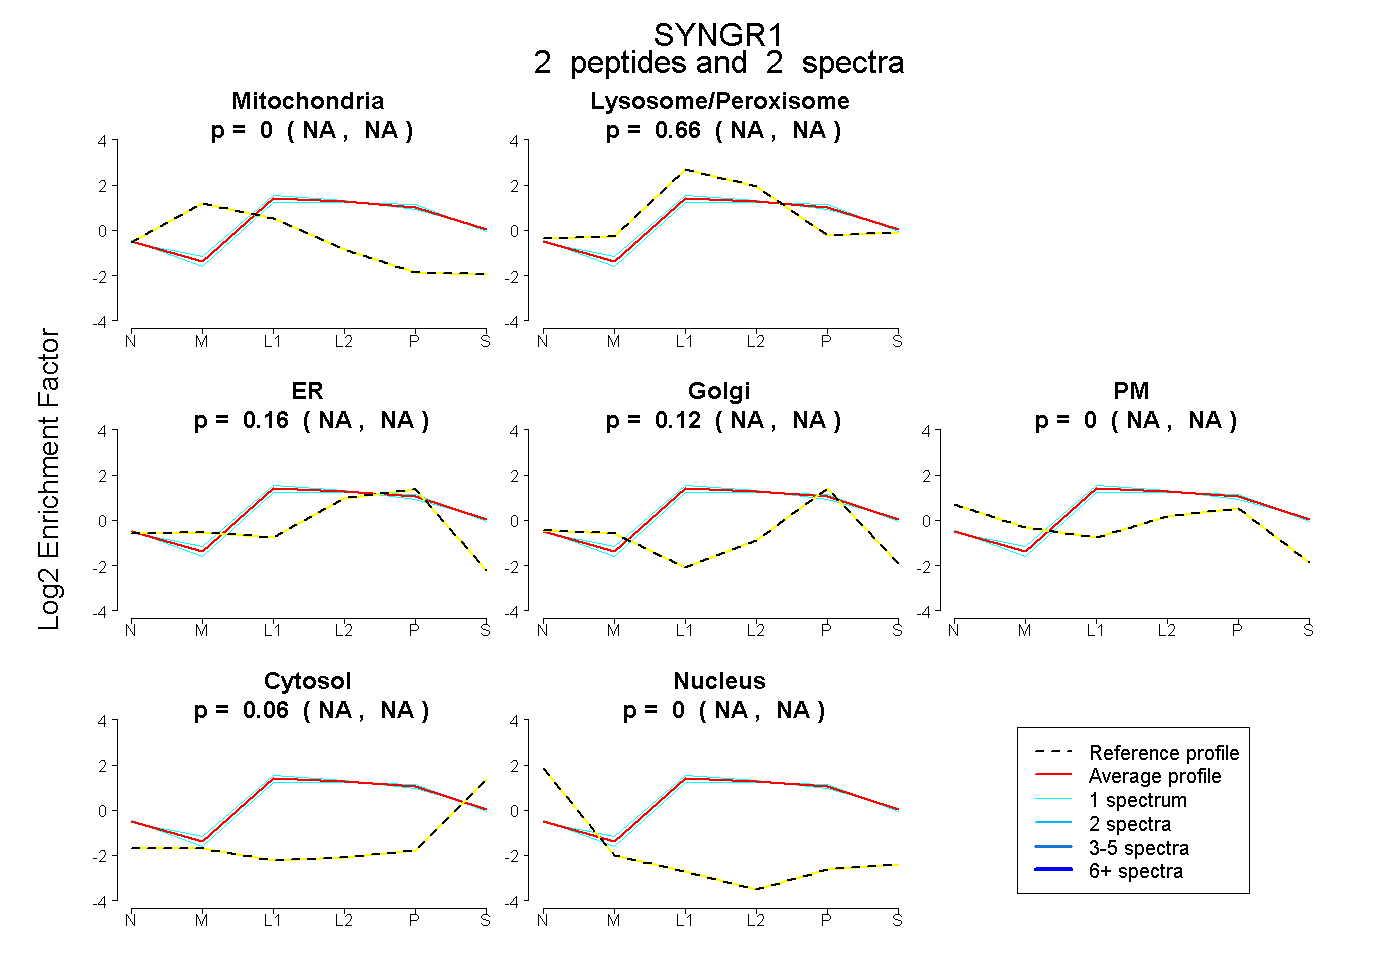
NA | NA
NA | NA
NA | NA
NA | NA
NA | NA
NA | NA
NA | NA
2peptides
spectra
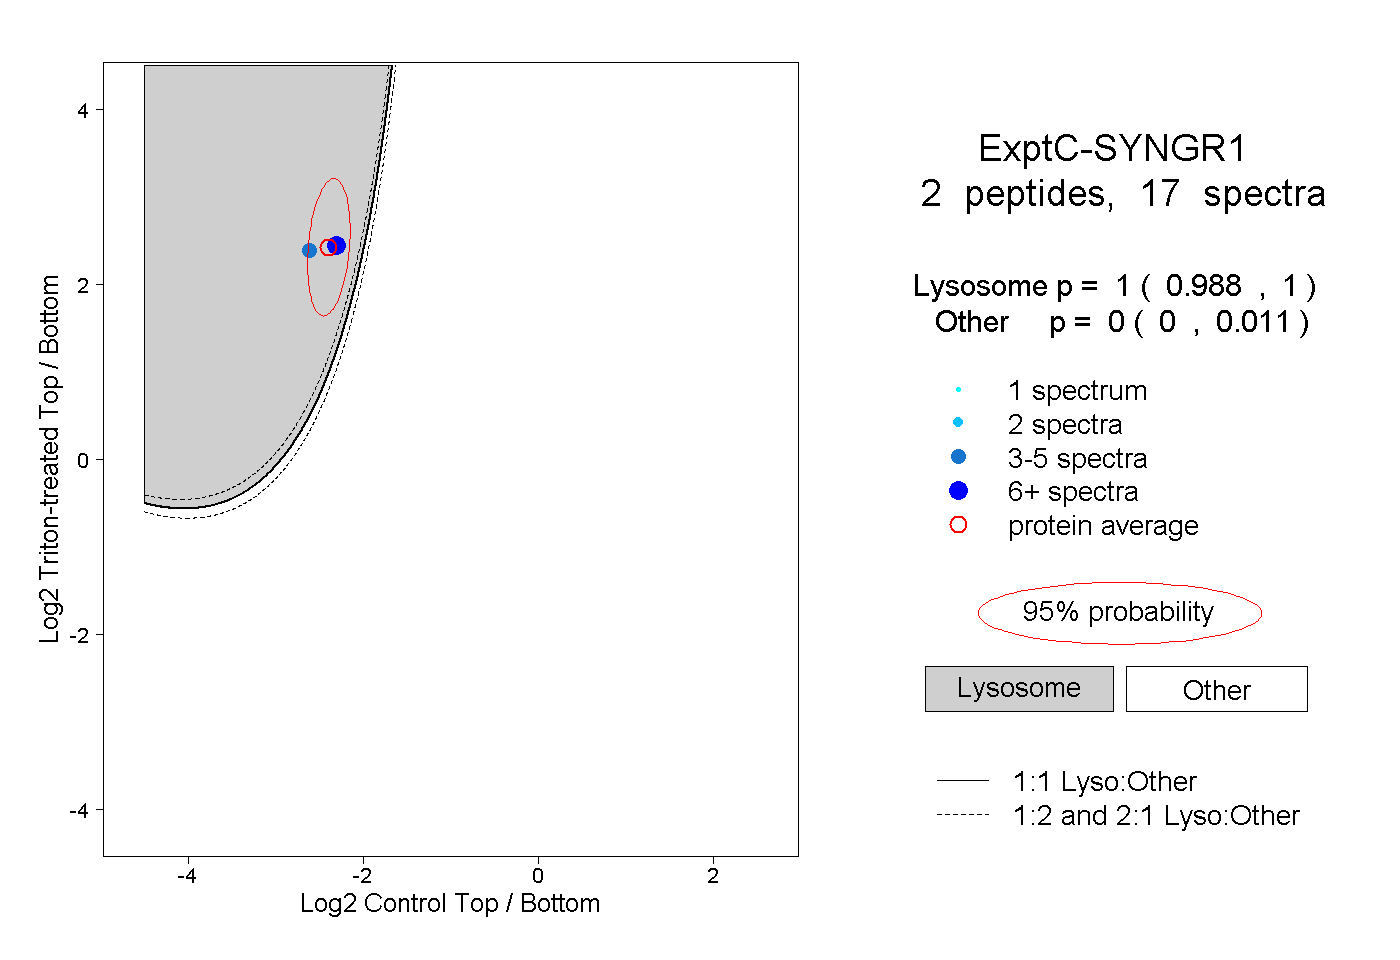
0.988 | 1.000
0.000 | 0.011
2peptides
spectra
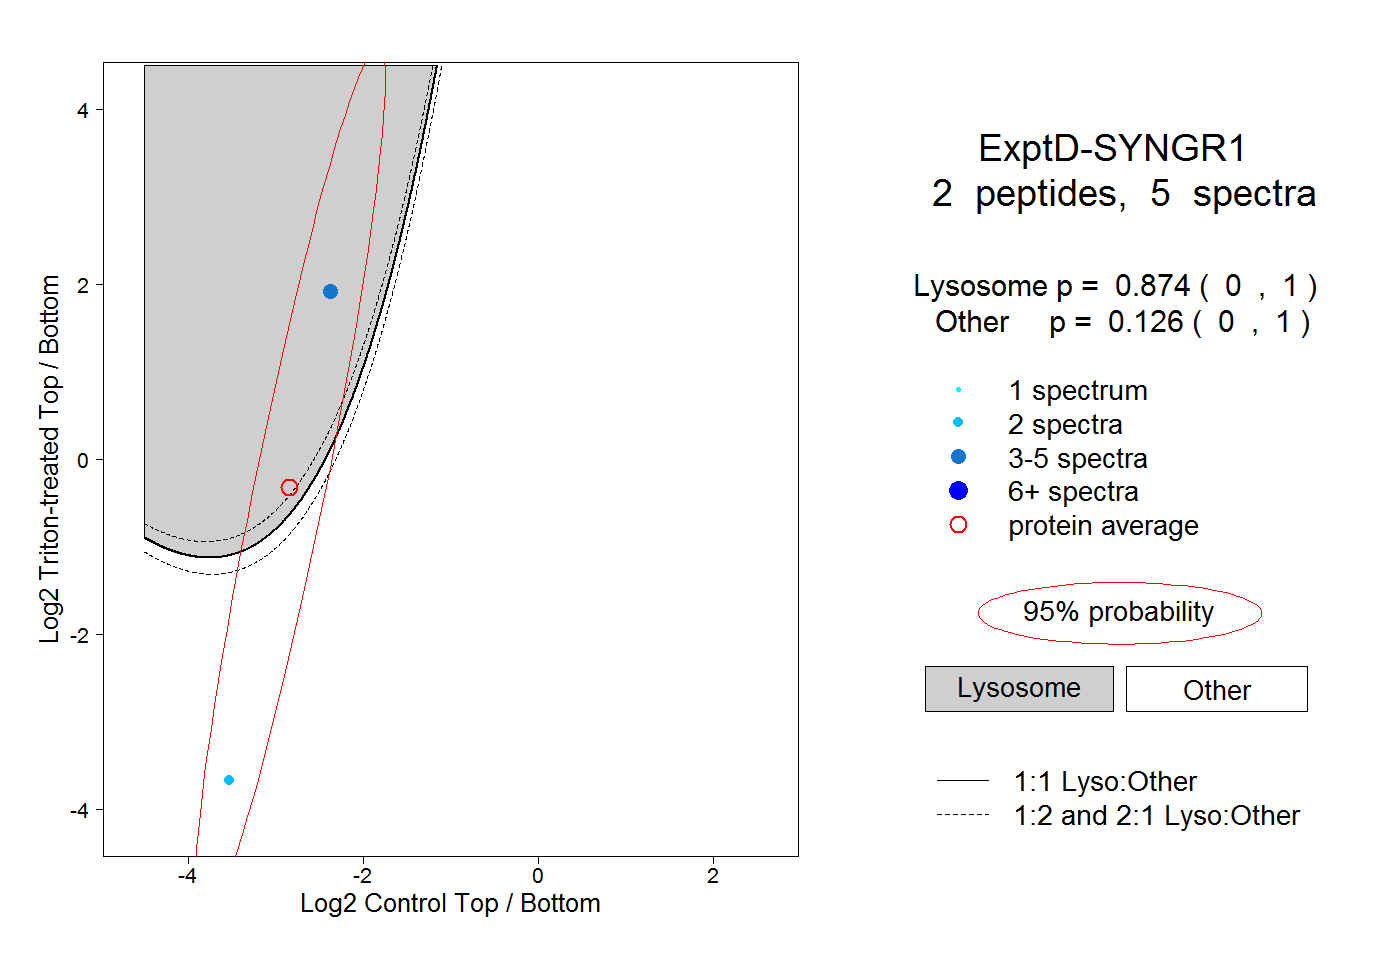
0.000 | 1.000
0.000 | 1.000