 3
3peptides
spectra
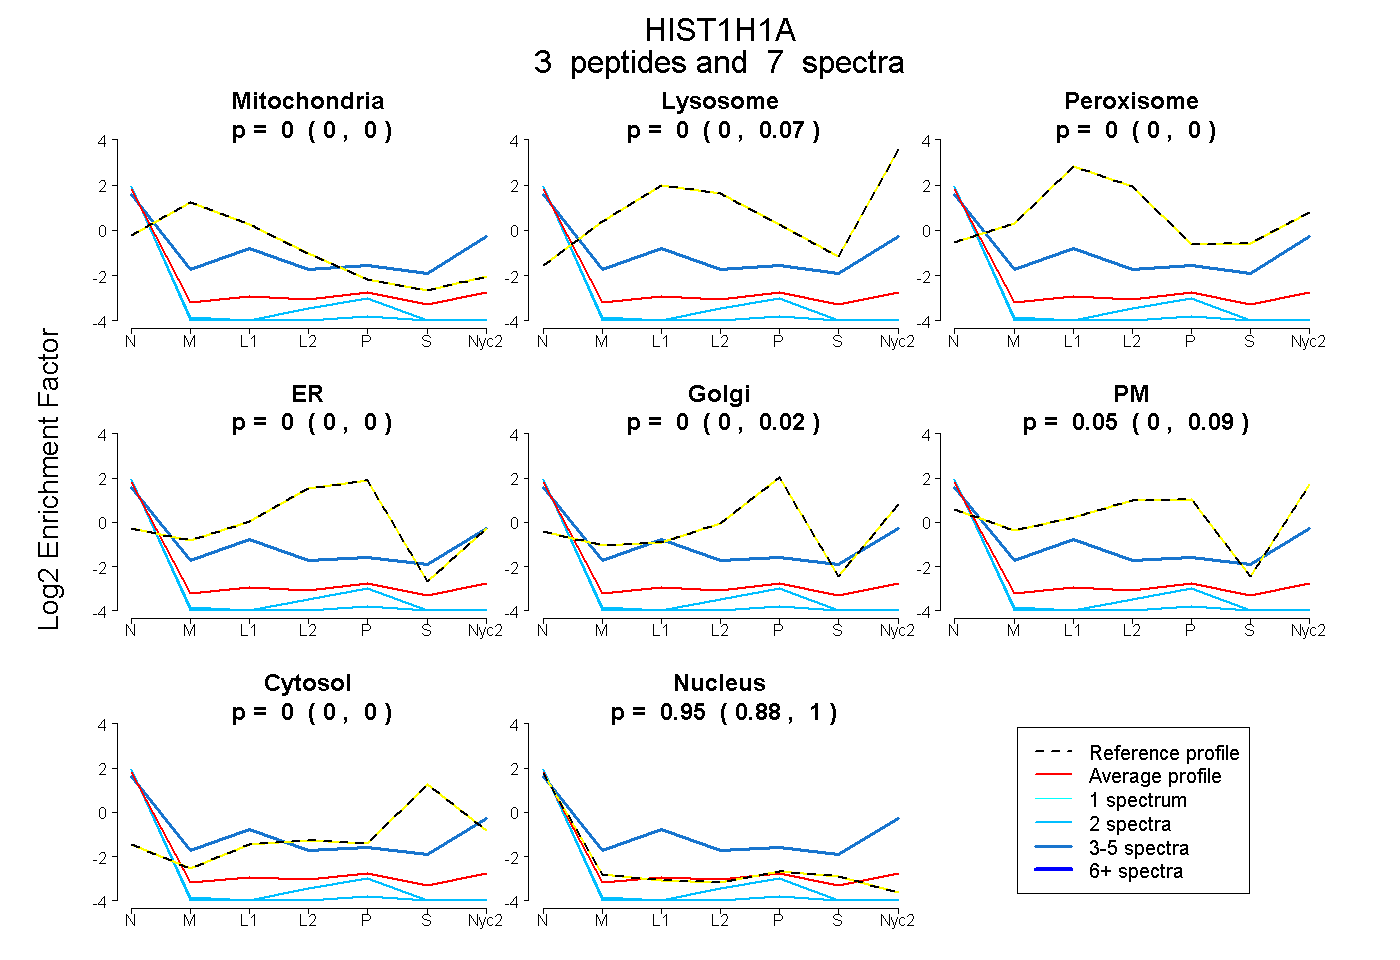
0.000 | 0.000
0.000 | 0.071
0.000 | 0.000
0.000 | 0.000
0.000 | 0.025
0.000 | 0.094
0.000 | 0.004
0.875 | 1.000
| Plot | Mito | Lyso | Perox | ER | Golgi | PM | Cytosol | Nucleus | |||||
| Expt A |
3 peptides |
7 spectra |
|
0.000 0.000 | 0.000 |
0.003 0.000 | 0.071 |
0.000 0.000 | 0.000 |
0.000 0.000 | 0.000 |
0.000 0.000 | 0.025 |
0.047 0.000 | 0.094 |
0.000 0.000 | 0.004 |
0.949 0.875 | 1.000 |
| 3 spectra, TAGAAAK | 0.000 | 0.287 | 0.008 | 0.000 | 0.000 | 0.126 | 0.000 | 0.579 | ||
| 2 spectra, SLAAAGYDVEK | 0.000 | 0.000 | 0.000 | 0.000 | 0.000 | 0.000 | 0.000 | 1.000 | ||
| 2 spectra, GTGAAGSFK | 0.000 | 0.000 | 0.000 | 0.000 | 0.000 | 0.000 | 0.000 | 1.000 |
| Plot | Lyso | Other | |||||||||||
| Expt C |
1 peptide |
1 spectrum |
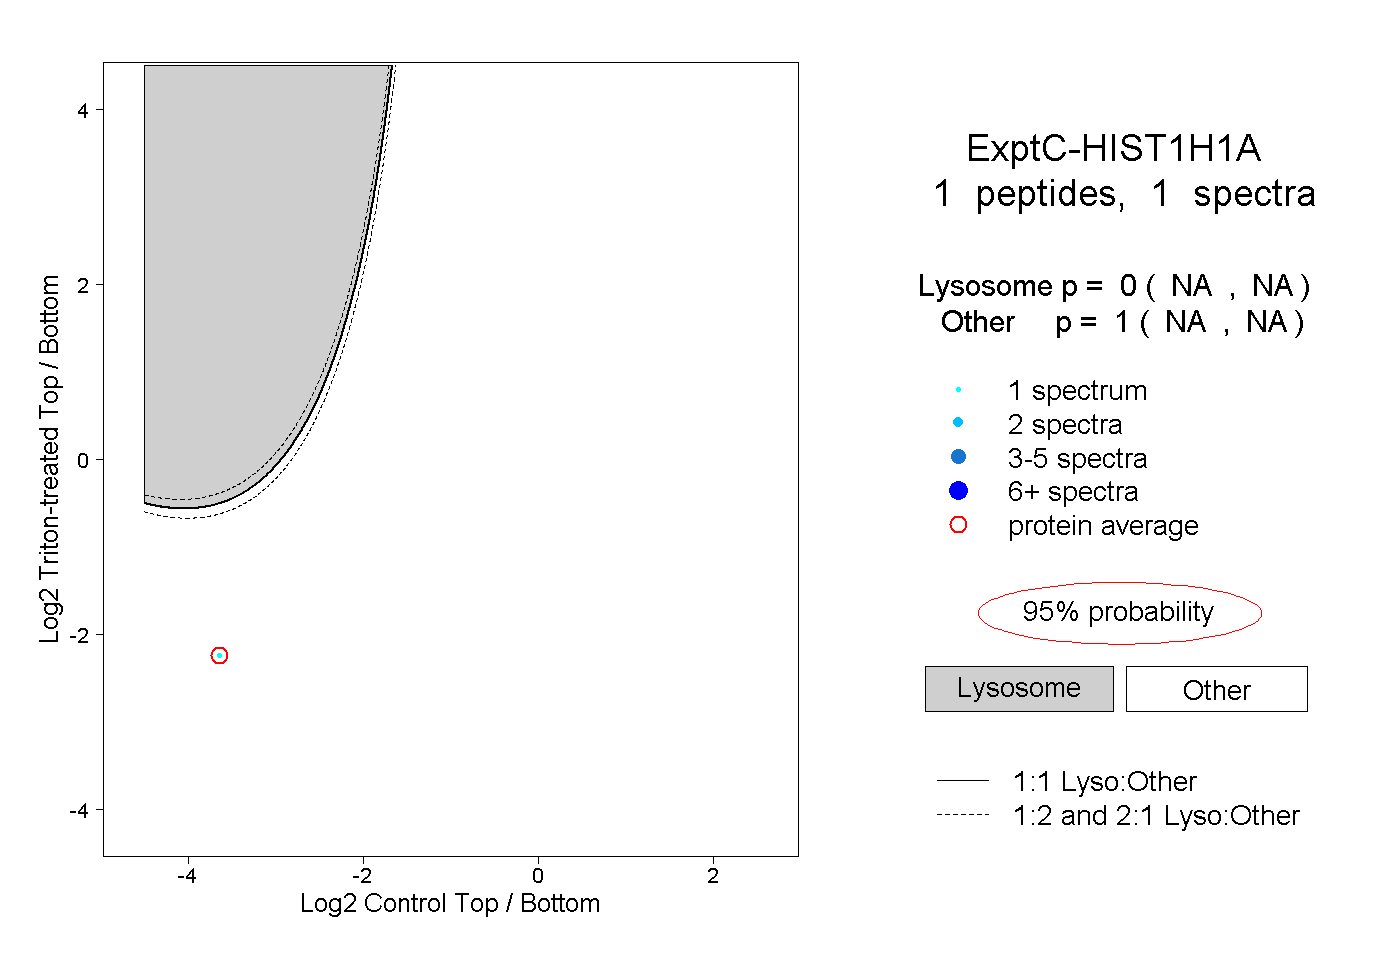 |
0.000 NA | NA |
1.000 NA | NA |