 3
3peptides
spectra
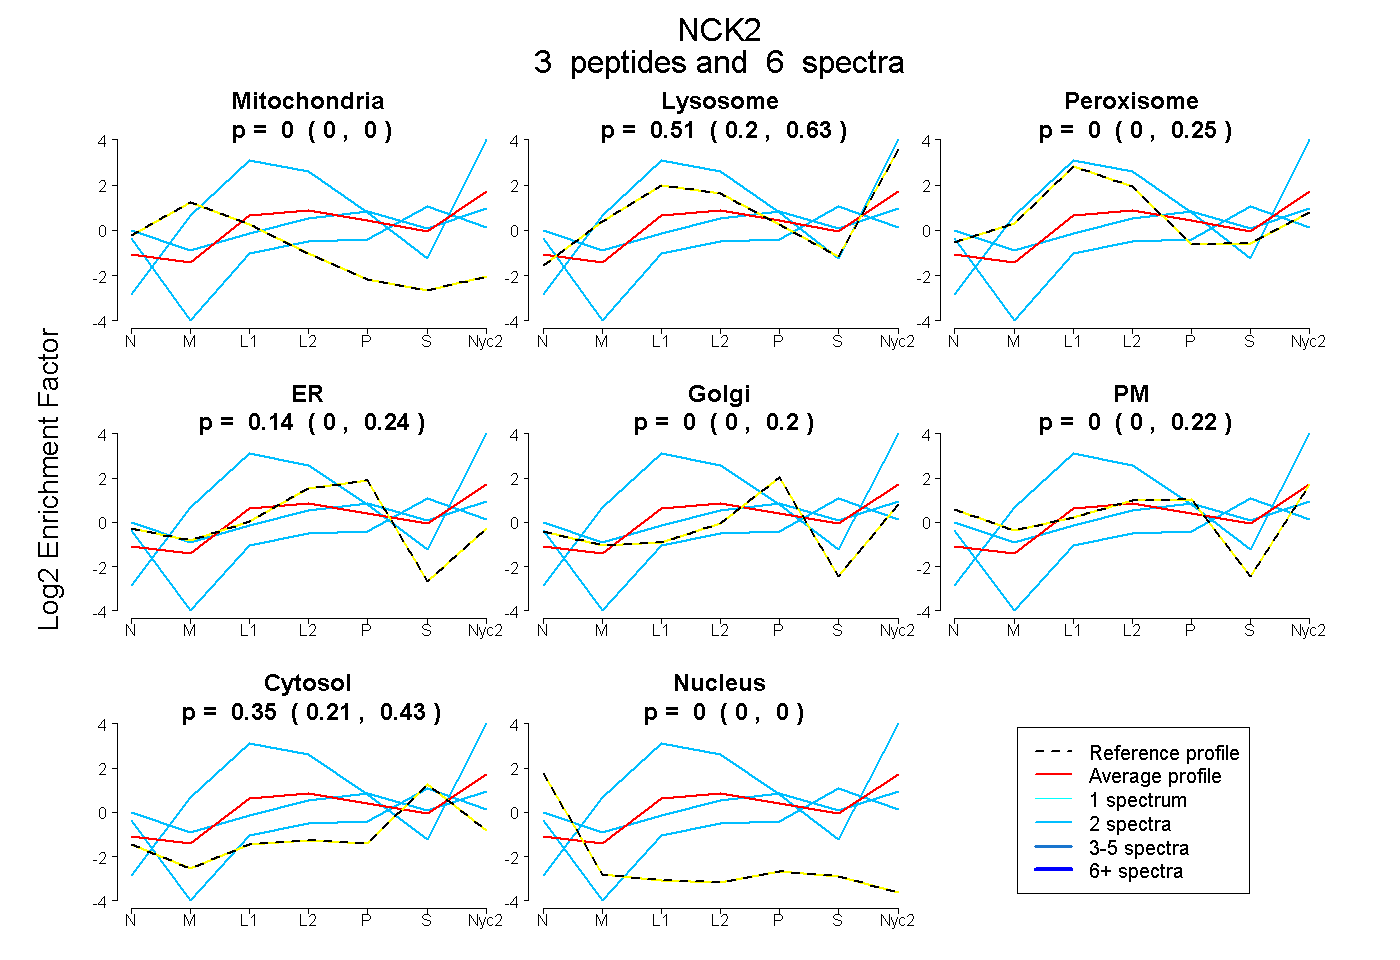
0.000 | 0.000
0.201 | 0.626
0.000 | 0.252
0.000 | 0.244
0.000 | 0.196
0.000 | 0.219
0.206 | 0.428
0.000 | 0.000
| Plot | Mito | Lyso | Perox | ER | Golgi | PM | Cytosol | Nucleus | |||||
| Expt A |
3 peptides |
6 spectra |
|
0.000 0.000 | 0.000 |
0.509 0.201 | 0.626 |
0.000 0.000 | 0.252 |
0.143 0.000 | 0.244 |
0.000 0.000 | 0.196 |
0.000 0.000 | 0.219 |
0.349 0.206 | 0.428 |
0.000 0.000 | 0.000 |
| 2 spectra, FHSMDELVEHYK | 0.000 | 1.000 | 0.000 | 0.000 | 0.000 | 0.000 | 0.000 | 0.000 | ||
| 2 spectra, HQAECALNER | 0.000 | 0.085 | 0.102 | 0.000 | 0.087 | 0.394 | 0.331 | 0.000 | ||
| 2 spectra, LWLLDDSK | 0.000 | 0.000 | 0.000 | 0.000 | 0.007 | 0.157 | 0.837 | 0.000 |
| Plot | Lyso | Other | |||||||||||
| Expt C |
2 peptides |
5 spectra |
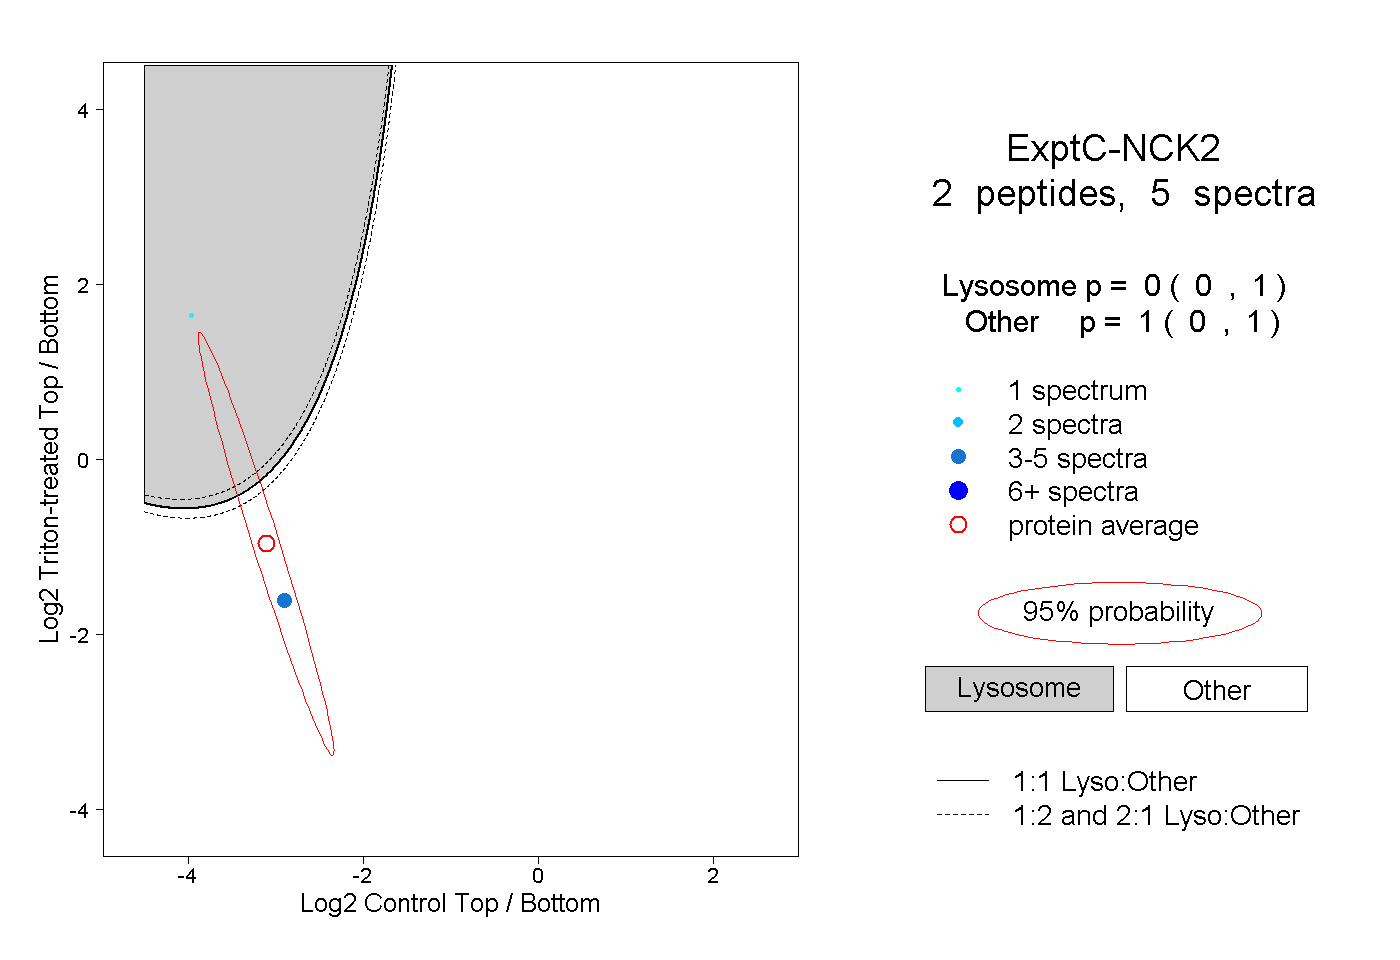 |
0.000 0.000 | 1.000 |
1.000 0.000 | 1.000 |