 2
2peptides
spectra
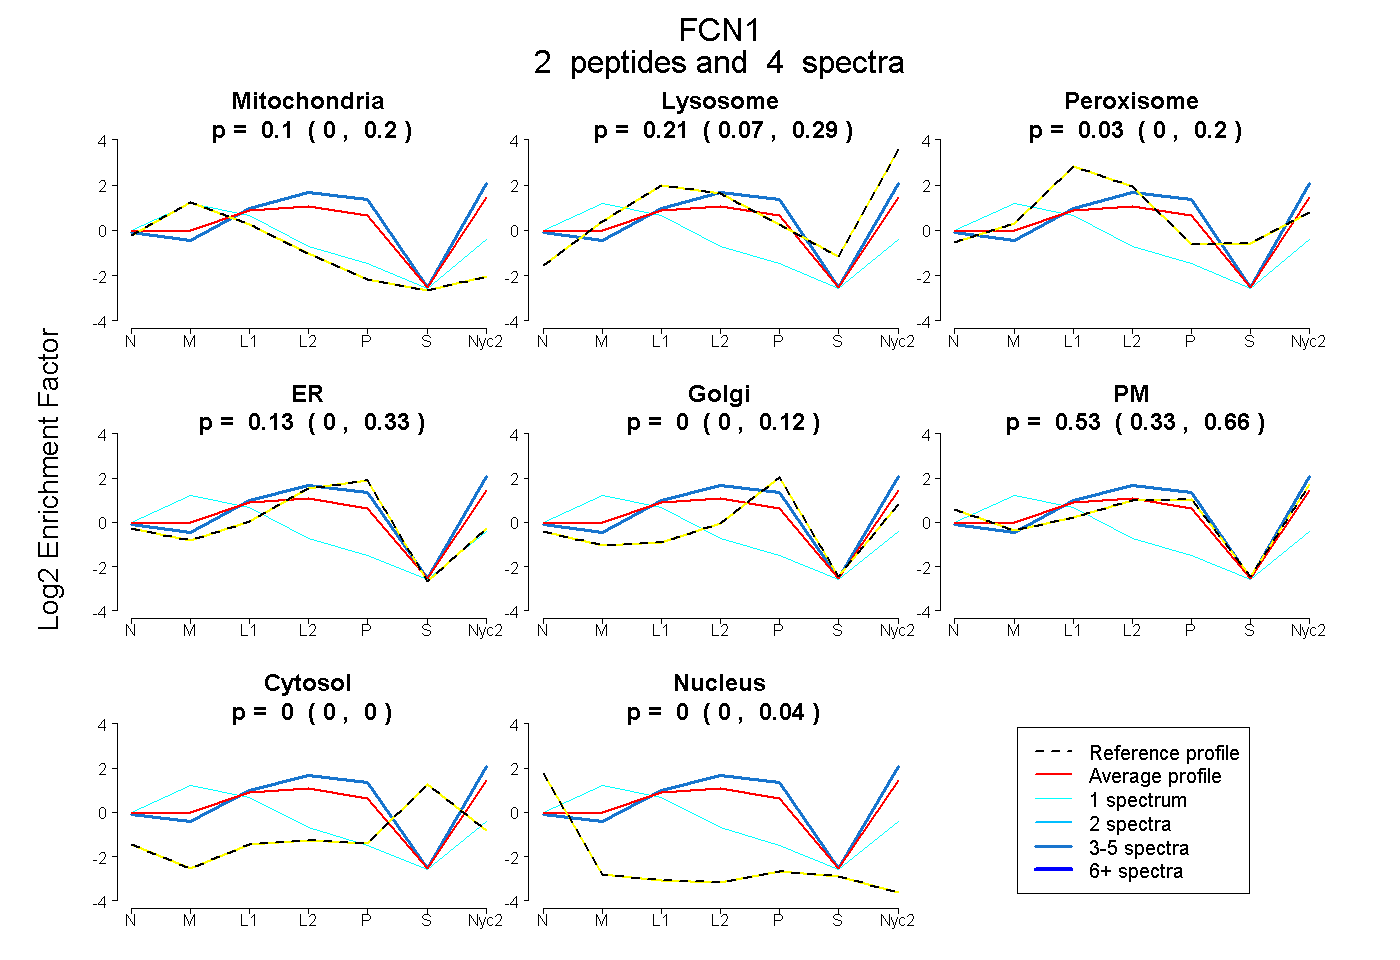
0.000 | 0.202
0.074 | 0.291
0.000 | 0.205
0.000 | 0.325
0.000 | 0.118
0.334 | 0.656
0.000 | 0.000
0.000 | 0.041
8peptides
spectra
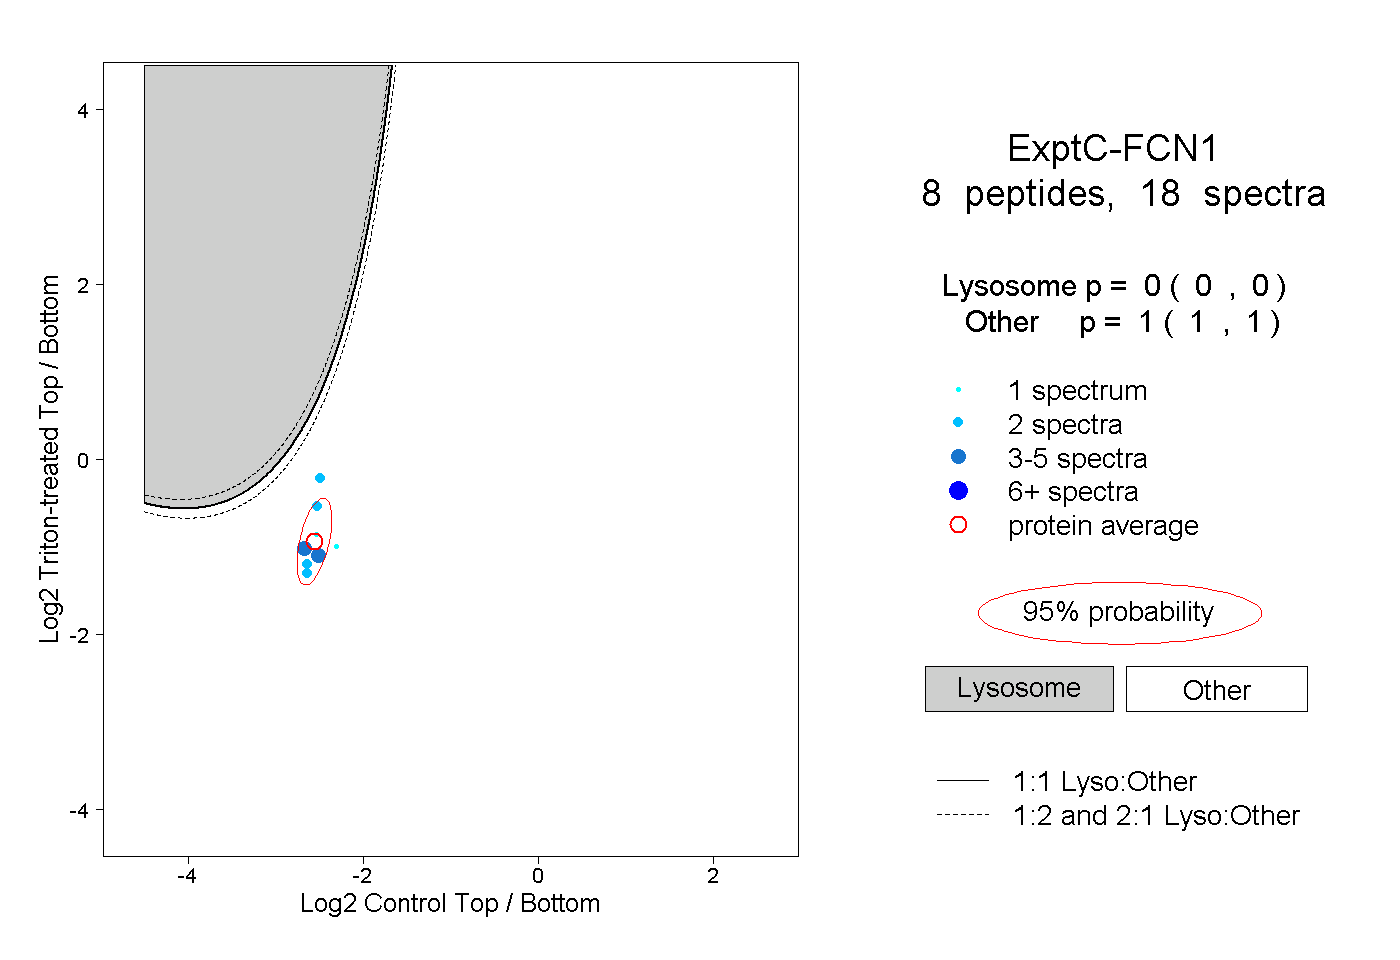
0.000 | 0.000
1.000 | 1.000
1peptide
spectrum
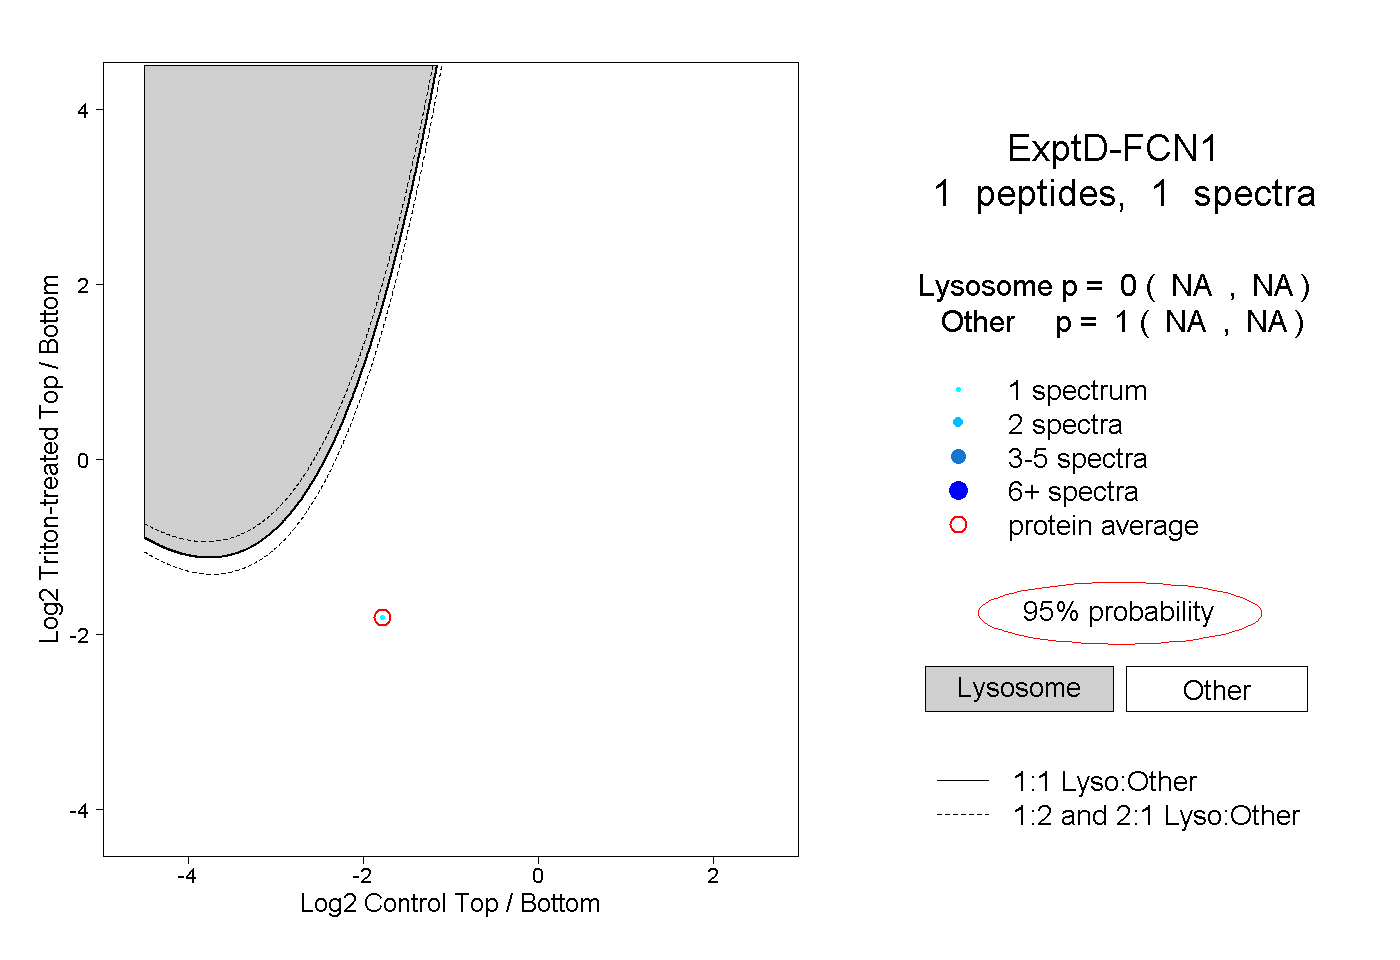
NA | NA
NA | NA