 3
3peptides
spectra
0.000 | 0.000
0.091 | 0.150
0.000 | 0.000
0.000 | 0.115
0.013 | 0.076
0.716 | 0.824
0.000 | 0.000
0.000 | 0.000
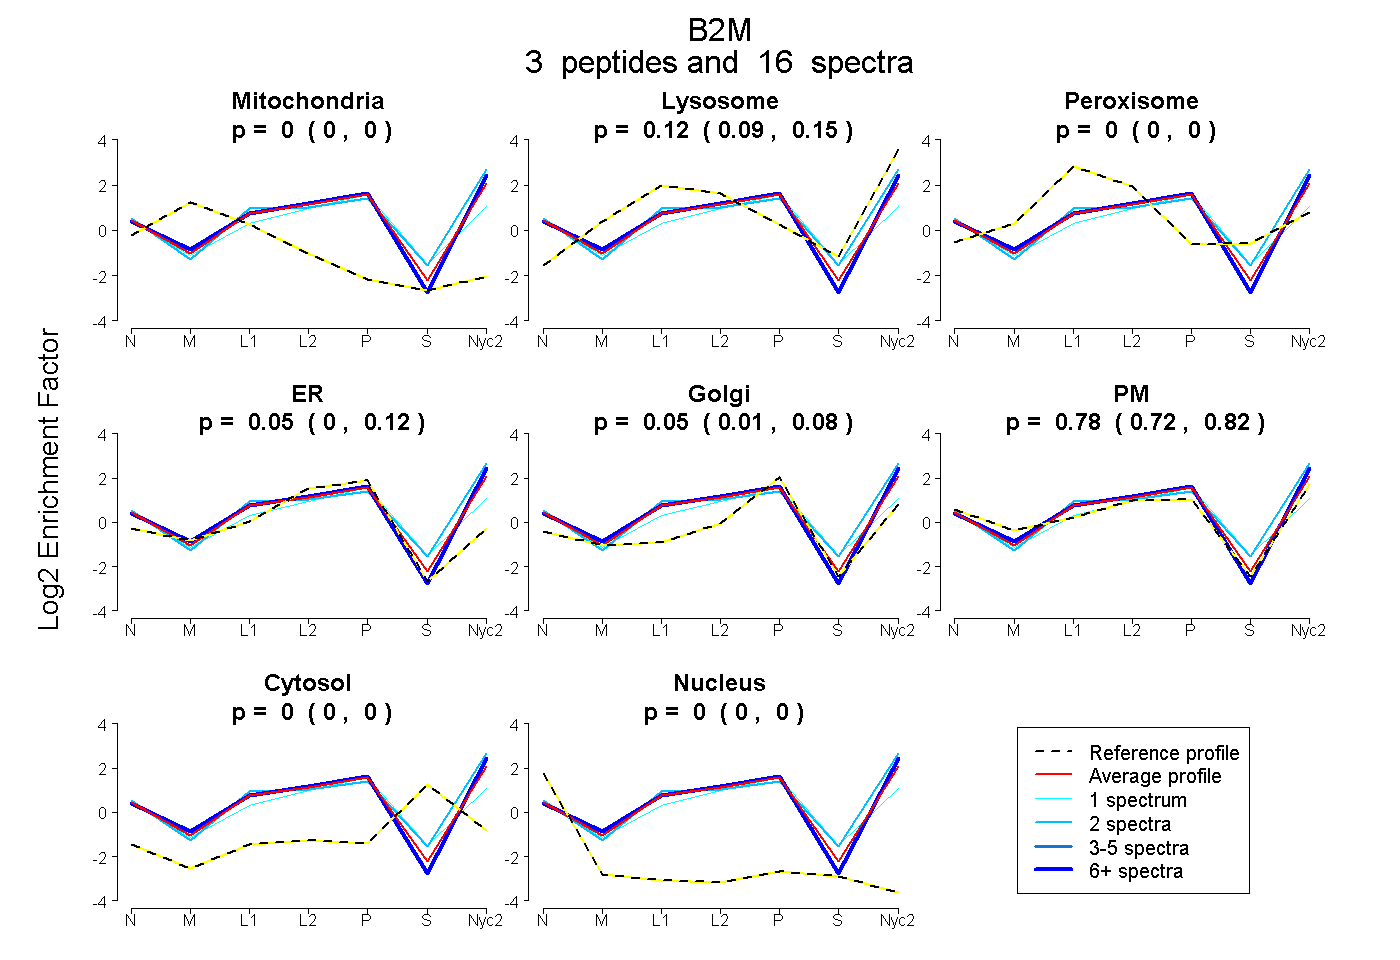
| Plot | Mito | Lyso | Perox | ER | Golgi | PM | Cytosol | Nucleus | |||||
| Expt A |
3 peptides |
16 spectra |
|
0.000 0.000 | 0.000 |
0.123 0.091 | 0.150 |
0.000 0.000 | 0.000 |
0.045 0.000 | 0.115 |
0.049 0.013 | 0.076 |
0.782 0.716 | 0.824 |
0.000 0.000 | 0.000 |
0.000 0.000 | 0.000 |
| 1 spectrum, DWSFYILAHTEFTPTETDVYACR | 0.000 | 0.000 | 0.071 | 0.191 | 0.123 | 0.532 | 0.082 | 0.000 | ||
| 13 spectra, TPQIQVYSR | 0.000 | 0.110 | 0.000 | 0.000 | 0.000 | 0.890 | 0.000 | 0.000 | ||
| 2 spectra, IPNIEMSDLSFSK | 0.000 | 0.237 | 0.000 | 0.000 | 0.000 | 0.747 | 0.016 | 0.000 |
| Plot | Mito | Lyso or Perox | ER | Golgi | PM | Cytosol | Nucleus | ||||||
| Expt B |
1 peptide |
3 spectra |
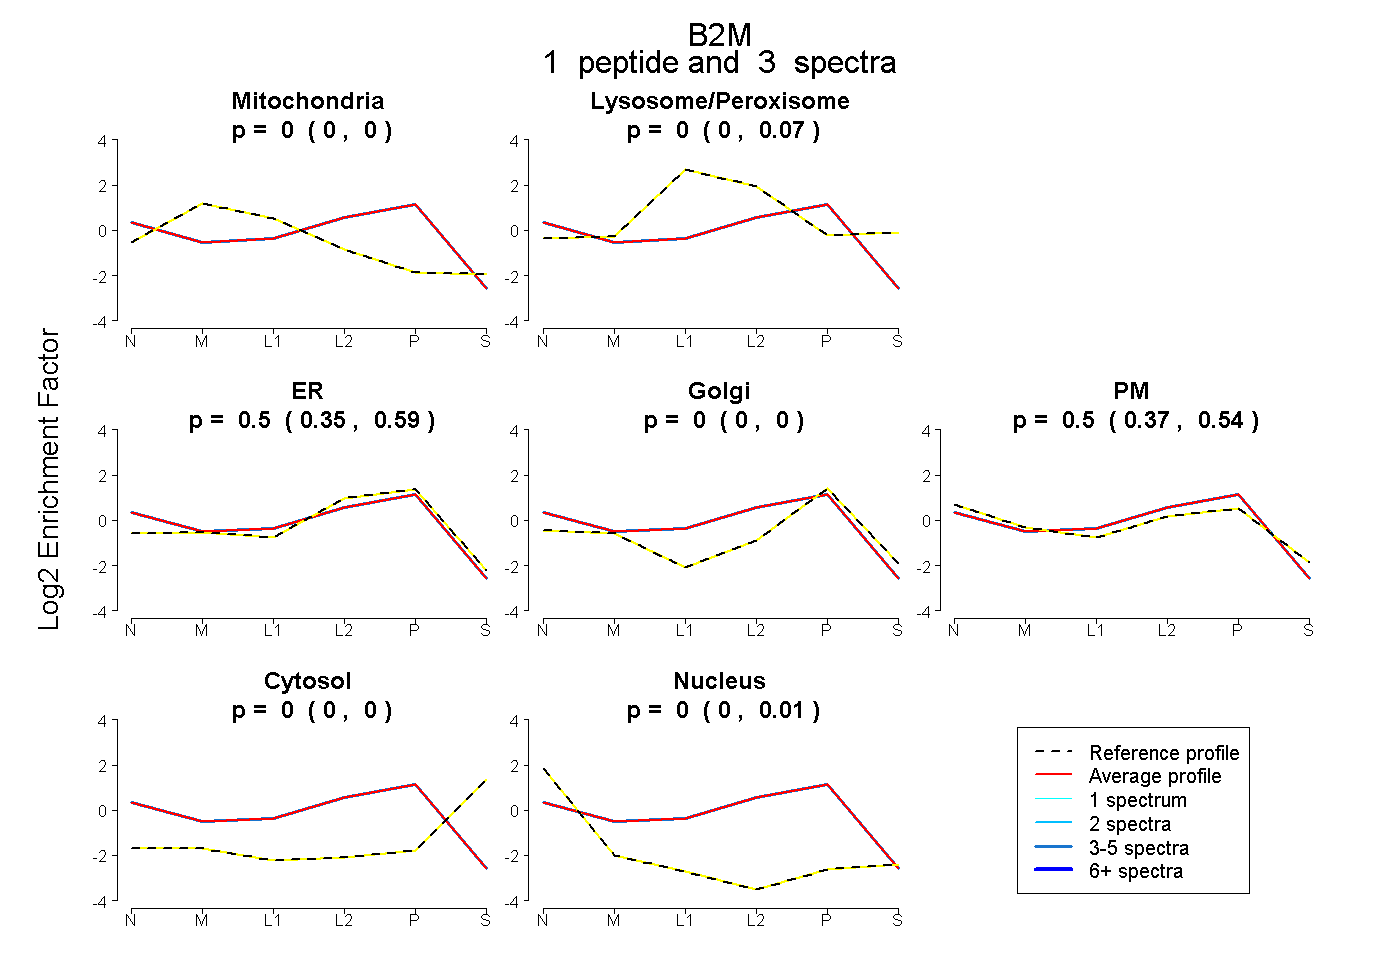 |
0.000 0.000 | 0.000 |
0.001 0.000 | 0.074 |
0.502 0.352 | 0.591 |
0.000 0.000 | 0.000 |
0.497 0.373 | 0.543 |
0.000 0.000 | 0.000 |
0.000 0.000 | 0.008 |
|||
| Plot | Lyso | Other | |||||||||||
| Expt C |
3 peptides |
50 spectra |
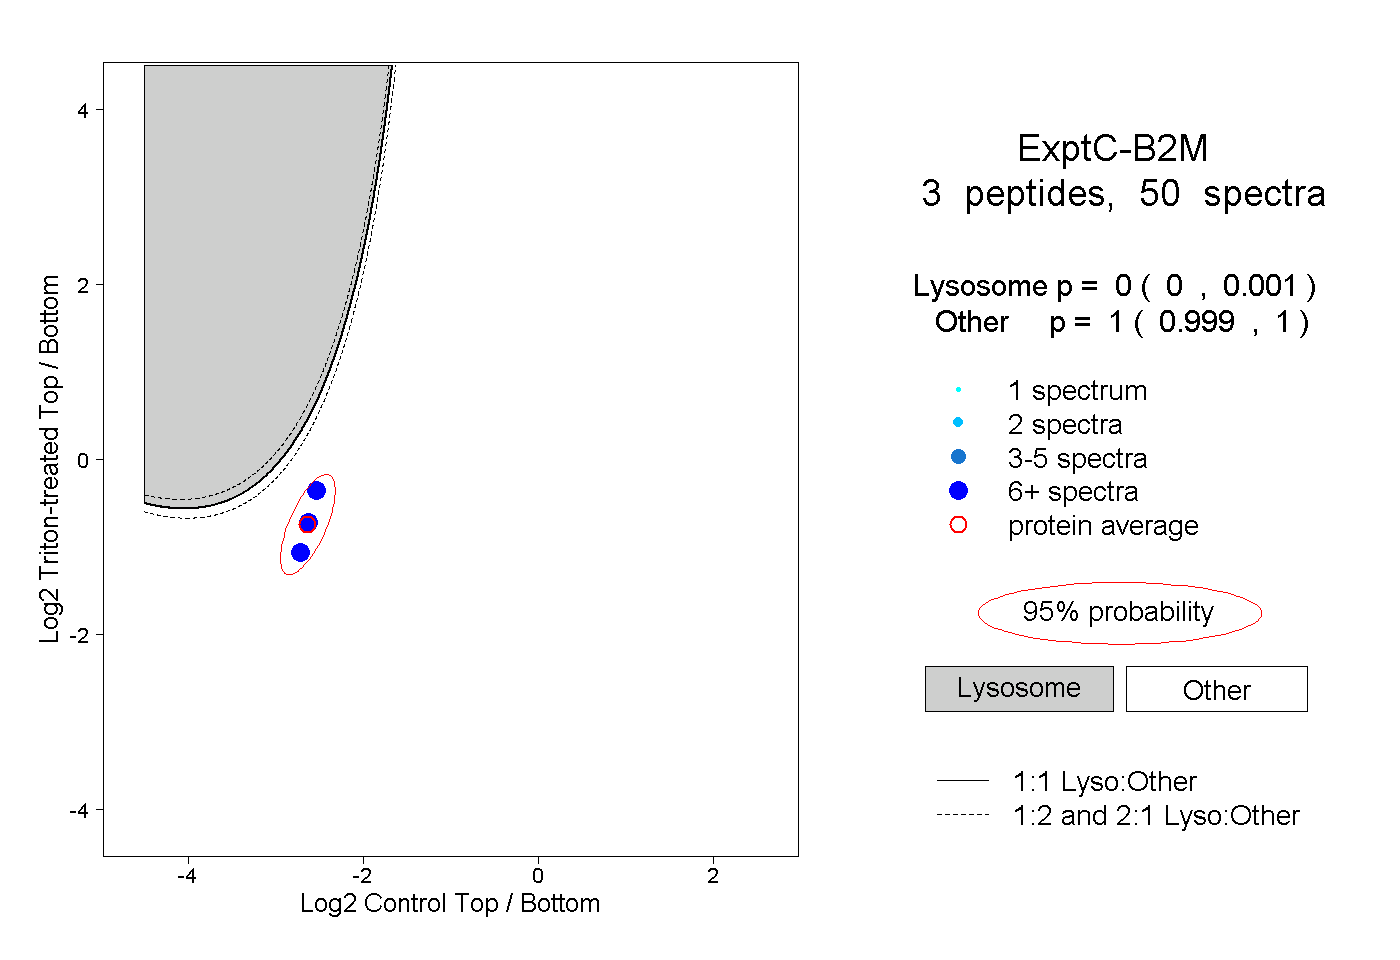 |
0.000 0.000 | 0.001 |
1.000 0.999 | 1.000 |
||||||||
| Plot | Lyso | Other | |||||||||||
| Expt D |
1 peptide |
1 spectrum |
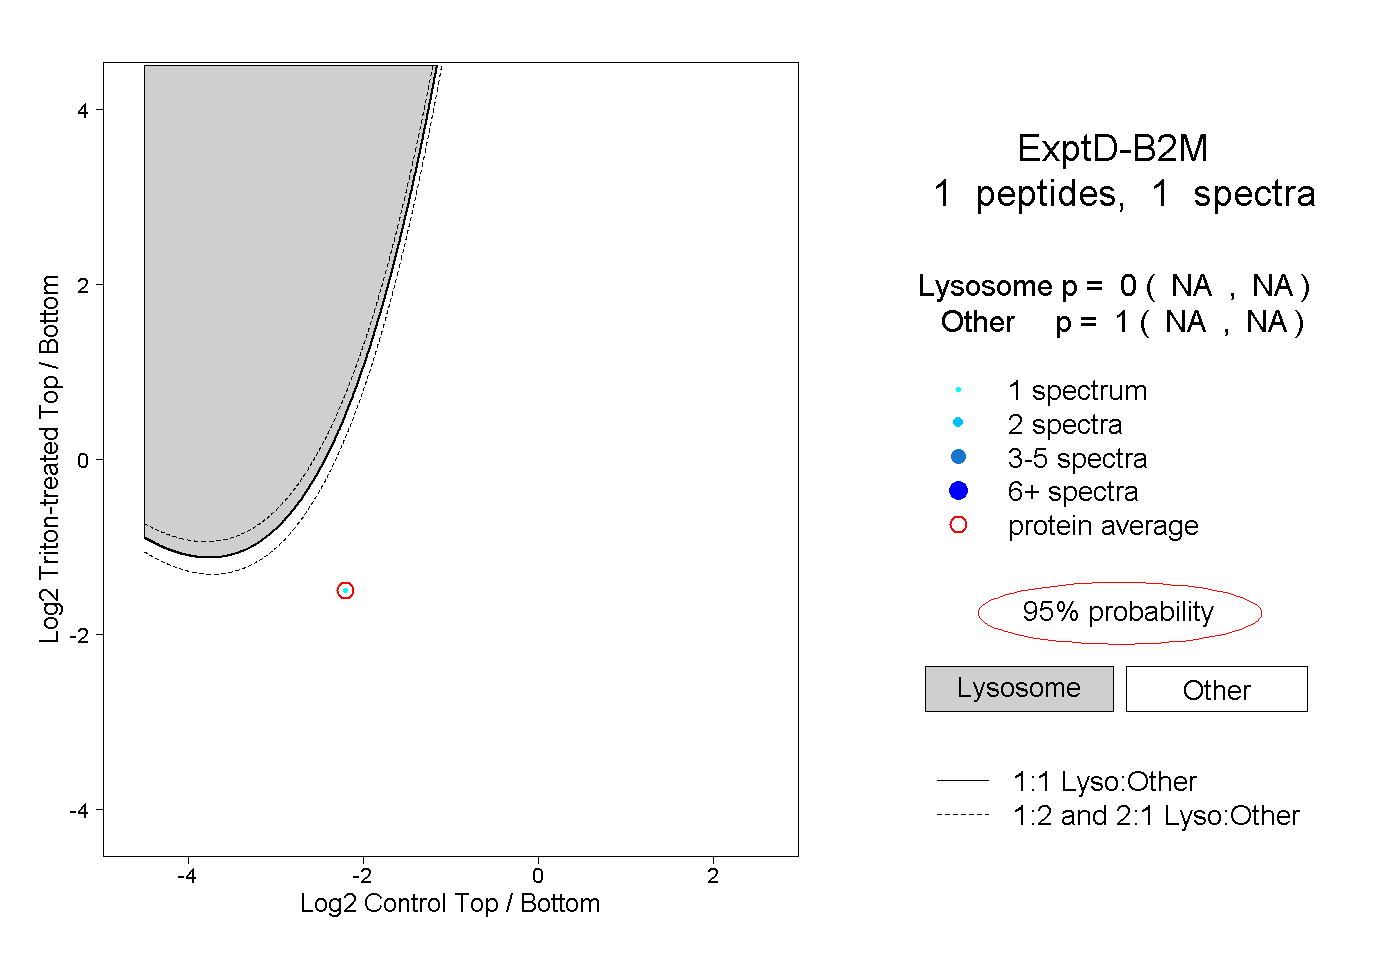 |
0.000 NA | NA |
1.000 NA | NA |