 3
3peptides
spectra
0.897 | 0.976
0.000 | 0.000
0.000 | 0.000
0.000 | 0.067
0.000 | 0.000
0.000 | 0.000
0.000 | 0.000
0.010 | 0.045
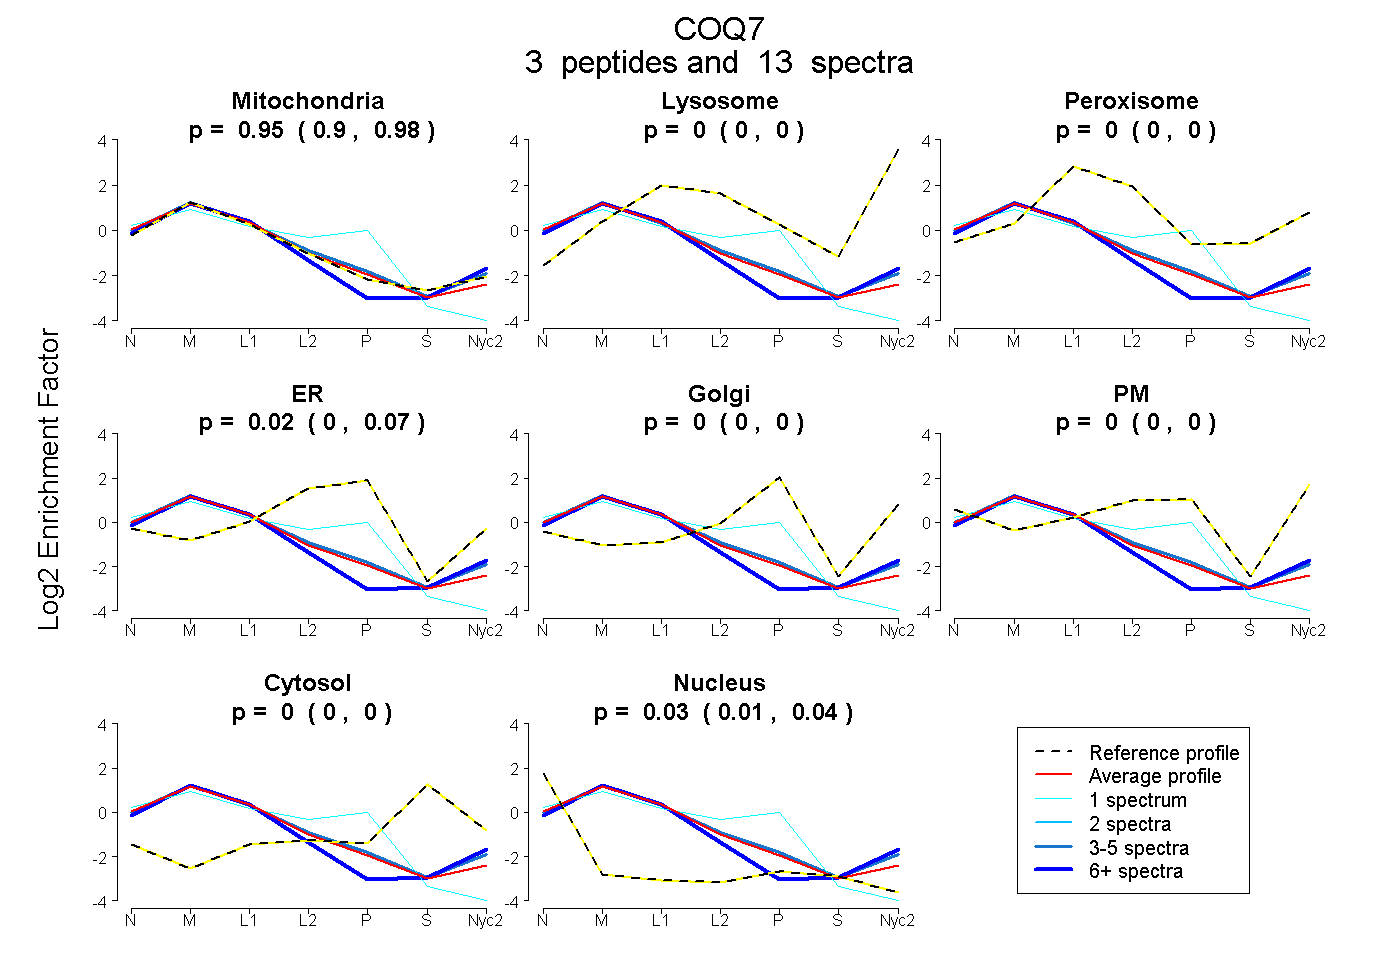
| Plot | Mito | Lyso | Perox | ER | Golgi | PM | Cytosol | Nucleus | |||||
| Expt A |
3 peptides |
13 spectra |
|
0.955 0.897 | 0.976 |
0.000 0.000 | 0.000 |
0.000 0.000 | 0.000 |
0.016 0.000 | 0.067 |
0.000 0.000 | 0.000 |
0.000 0.000 | 0.000 |
0.000 0.000 | 0.000 |
0.029 0.010 | 0.045 |
| 9 spectra, IYAGQMAVLGR | 0.982 | 0.000 | 0.000 | 0.000 | 0.000 | 0.000 | 0.000 | 0.018 | ||
| 1 spectrum, TSVGPVIQK | 0.643 | 0.000 | 0.000 | 0.264 | 0.000 | 0.000 | 0.000 | 0.092 | ||
| 3 spectra, FNELMVAFR | 0.932 | 0.000 | 0.000 | 0.029 | 0.000 | 0.039 | 0.000 | 0.000 |
| Plot | Mito | Lyso or Perox | ER | Golgi | PM | Cytosol | Nucleus | ||||||
| Expt B |
2 peptides |
4 spectra |
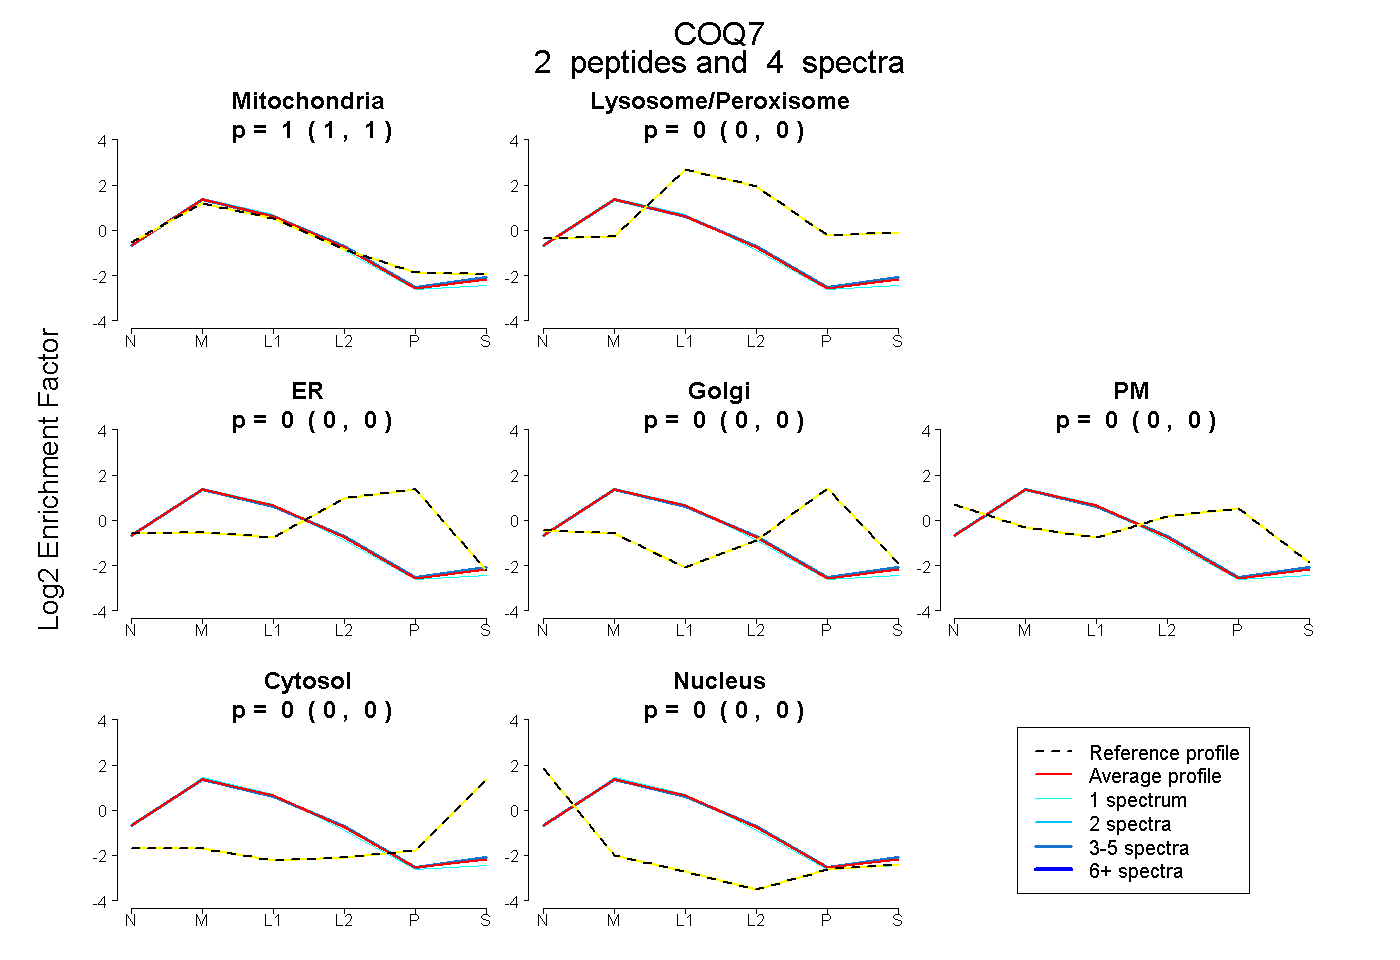 |
1.000 1.000 | 1.000 |
0.000 0.000 | 0.000 |
0.000 0.000 | 0.000 |
0.000 0.000 | 0.000 |
0.000 0.000 | 0.000 |
0.000 0.000 | 0.000 |
0.000 0.000 | 0.000 |
|||
| Plot | Lyso | Other | |||||||||||
| Expt C |
6 peptides |
28 spectra |
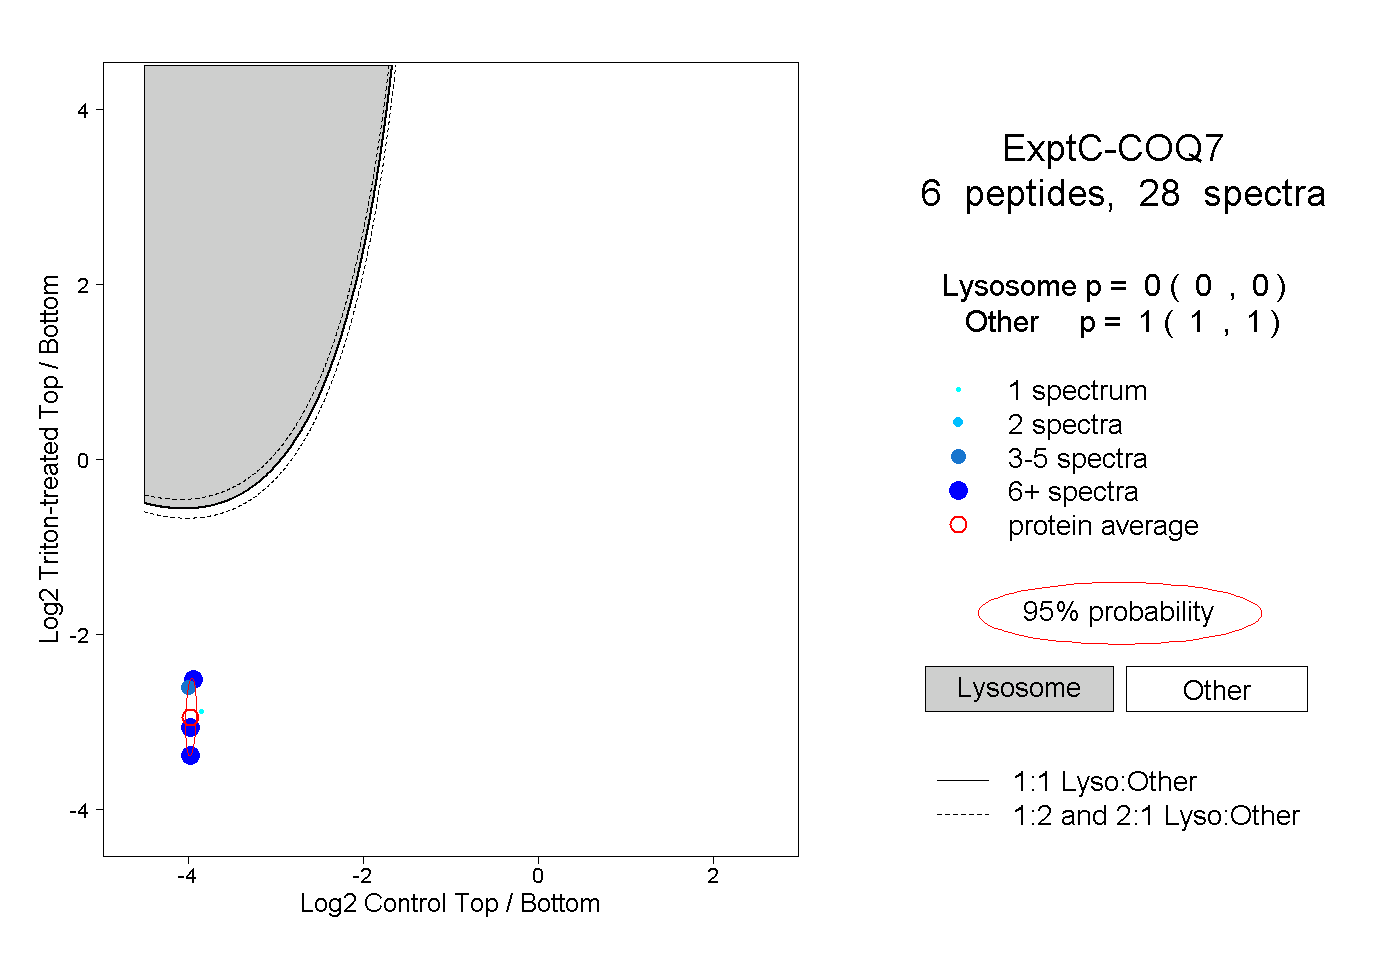 |
0.000 0.000 | 0.000 |
1.000 1.000 | 1.000 |
||||||||
| Plot | Lyso | Other | |||||||||||
| Expt D |
3 peptides |
5 spectra |
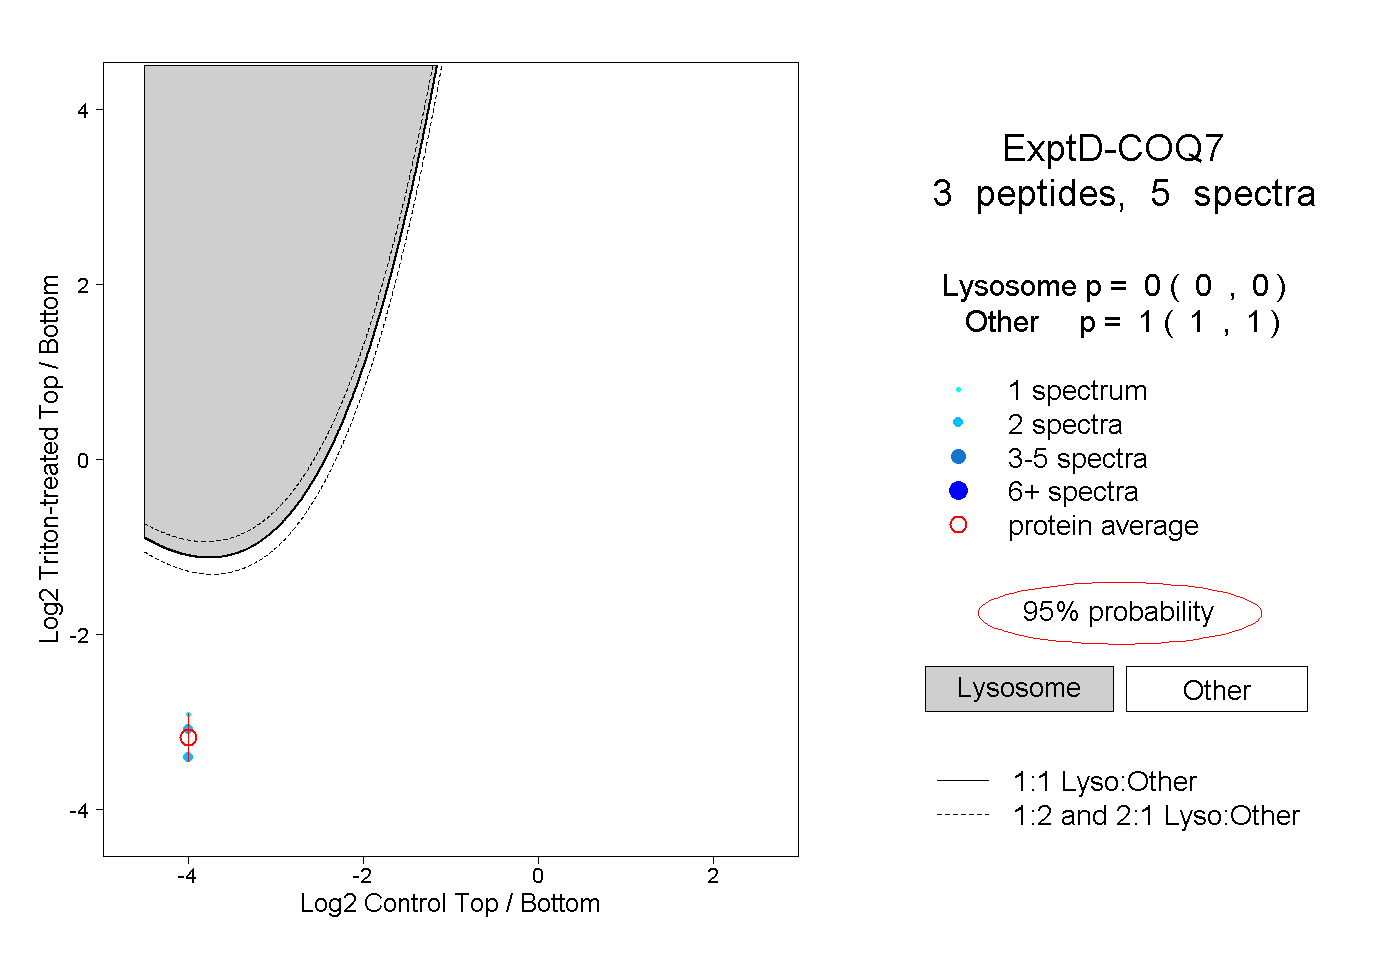 |
0.000 0.000 | 0.000 |
1.000 1.000 | 1.000 |