 4
4peptides
spectra
0.000 | 0.002
0.028 | 0.077
0.000 | 0.000
0.000 | 0.000
0.000 | 0.000
0.000 | 0.031
0.909 | 0.950
0.000 | 0.003
3peptides
spectra
0.000 | 0.000
1.000 | 1.000
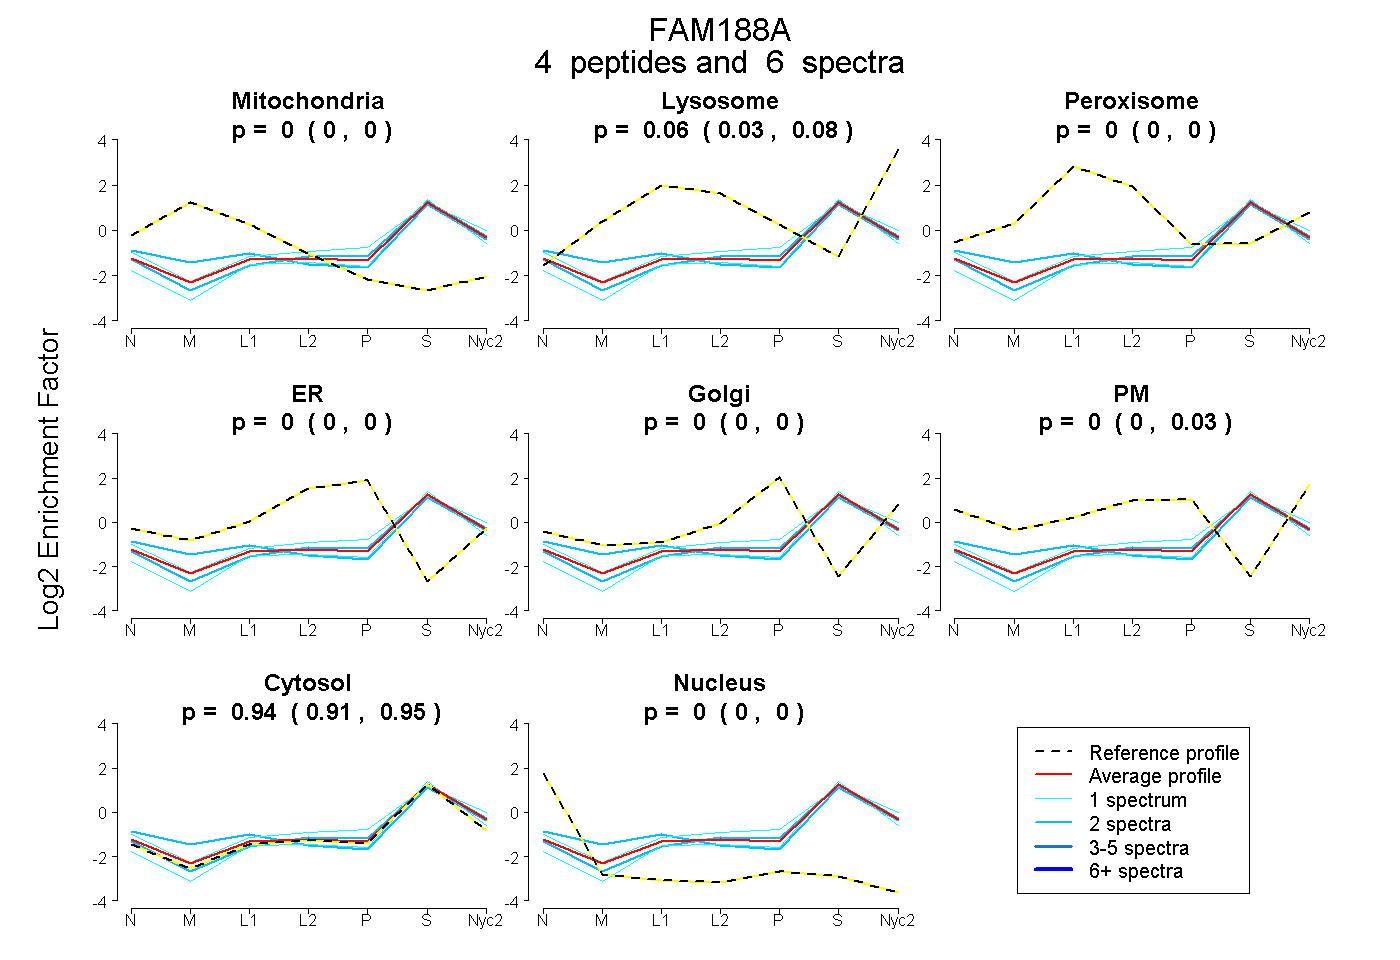
| Plot | Mito | Lyso | Perox | ER | Golgi | PM | Cytosol | Nucleus | |||||
| Expt A |
4 peptides |
6 spectra |
|
0.000 0.000 | 0.002 |
0.063 0.028 | 0.077 |
0.000 0.000 | 0.000 |
0.000 0.000 | 0.000 |
0.000 0.000 | 0.000 |
0.001 0.000 | 0.031 |
0.936 0.909 | 0.950 |
0.000 0.000 | 0.003 |
||
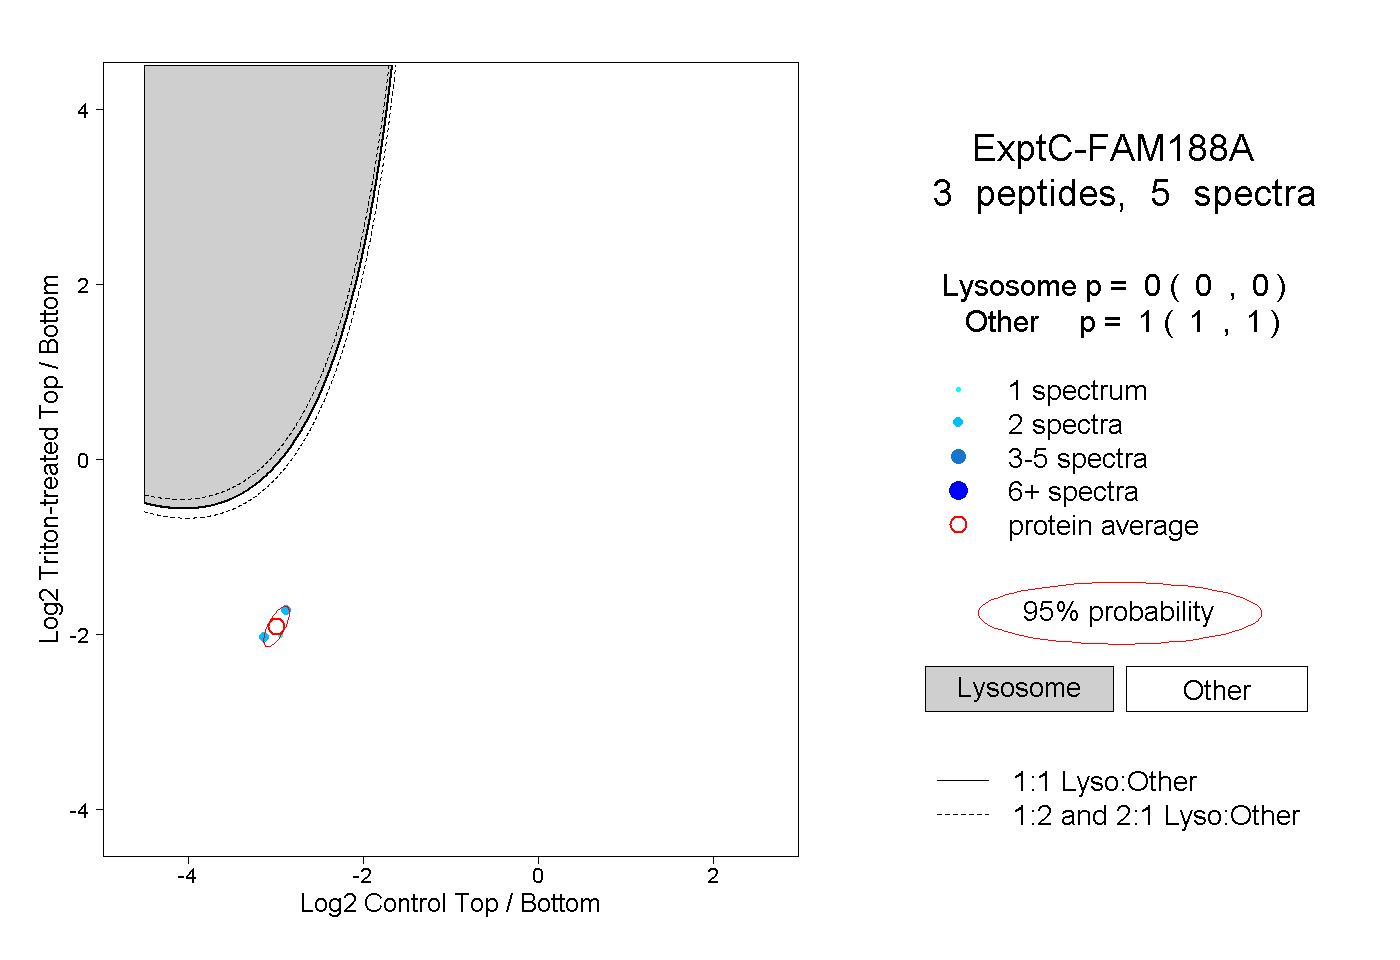
| Plot | Lyso | Other | |||||||||||
| Expt C |
3 peptides |
5 spectra |
|
0.000 0.000 | 0.000 |
1.000 1.000 | 1.000 |