 19
19peptides
spectra
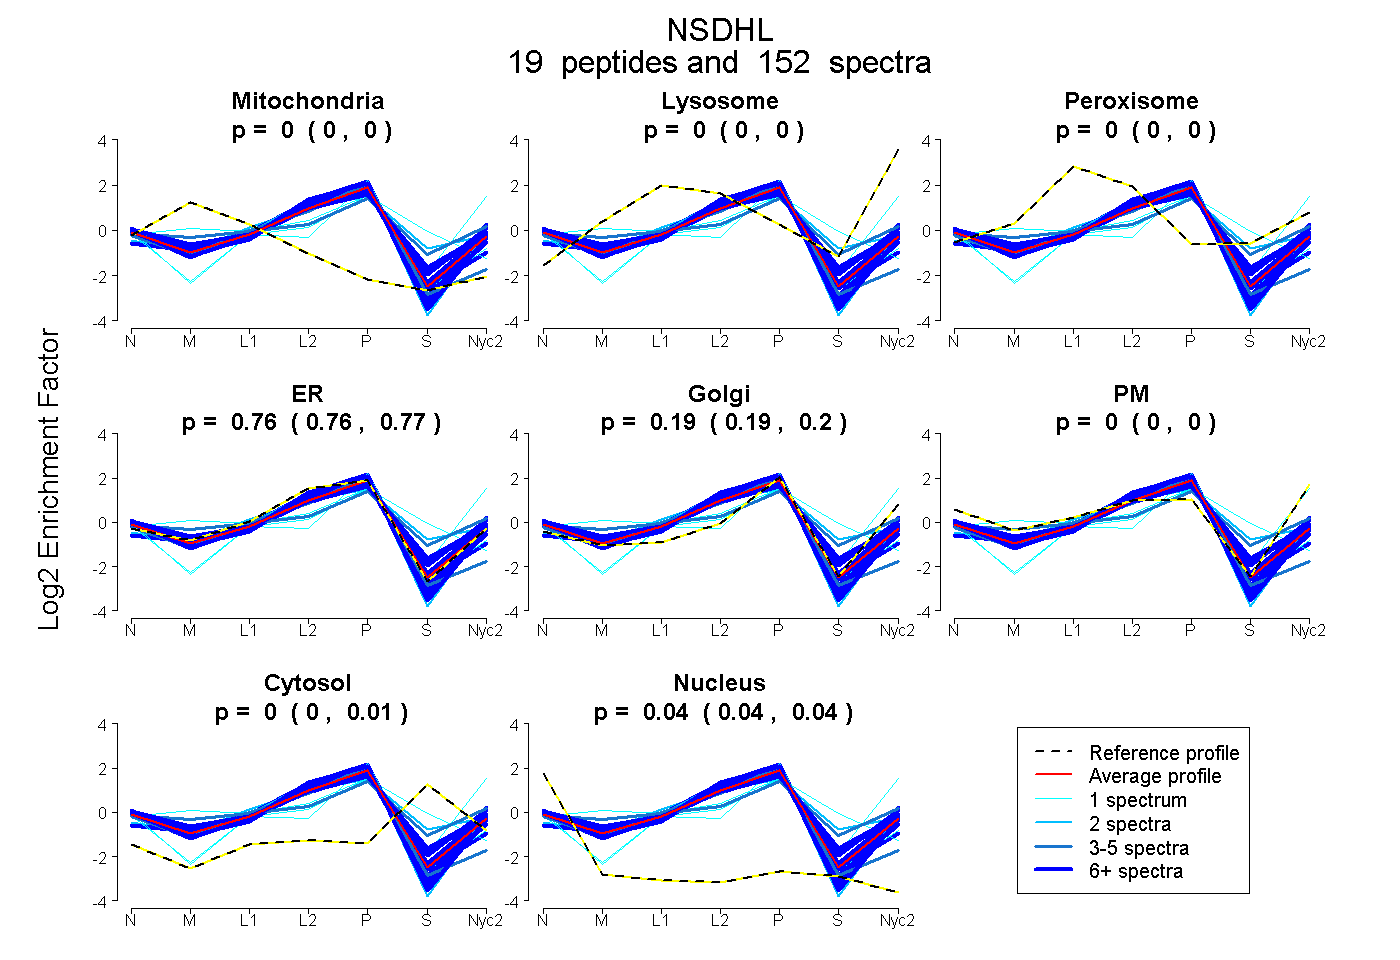
0.000 | 0.000
0.000 | 0.000
0.000 | 0.000
0.756 | 0.768
0.186 | 0.200
0.000 | 0.000
0.000 | 0.008
0.038 | 0.043
16peptides
spectra
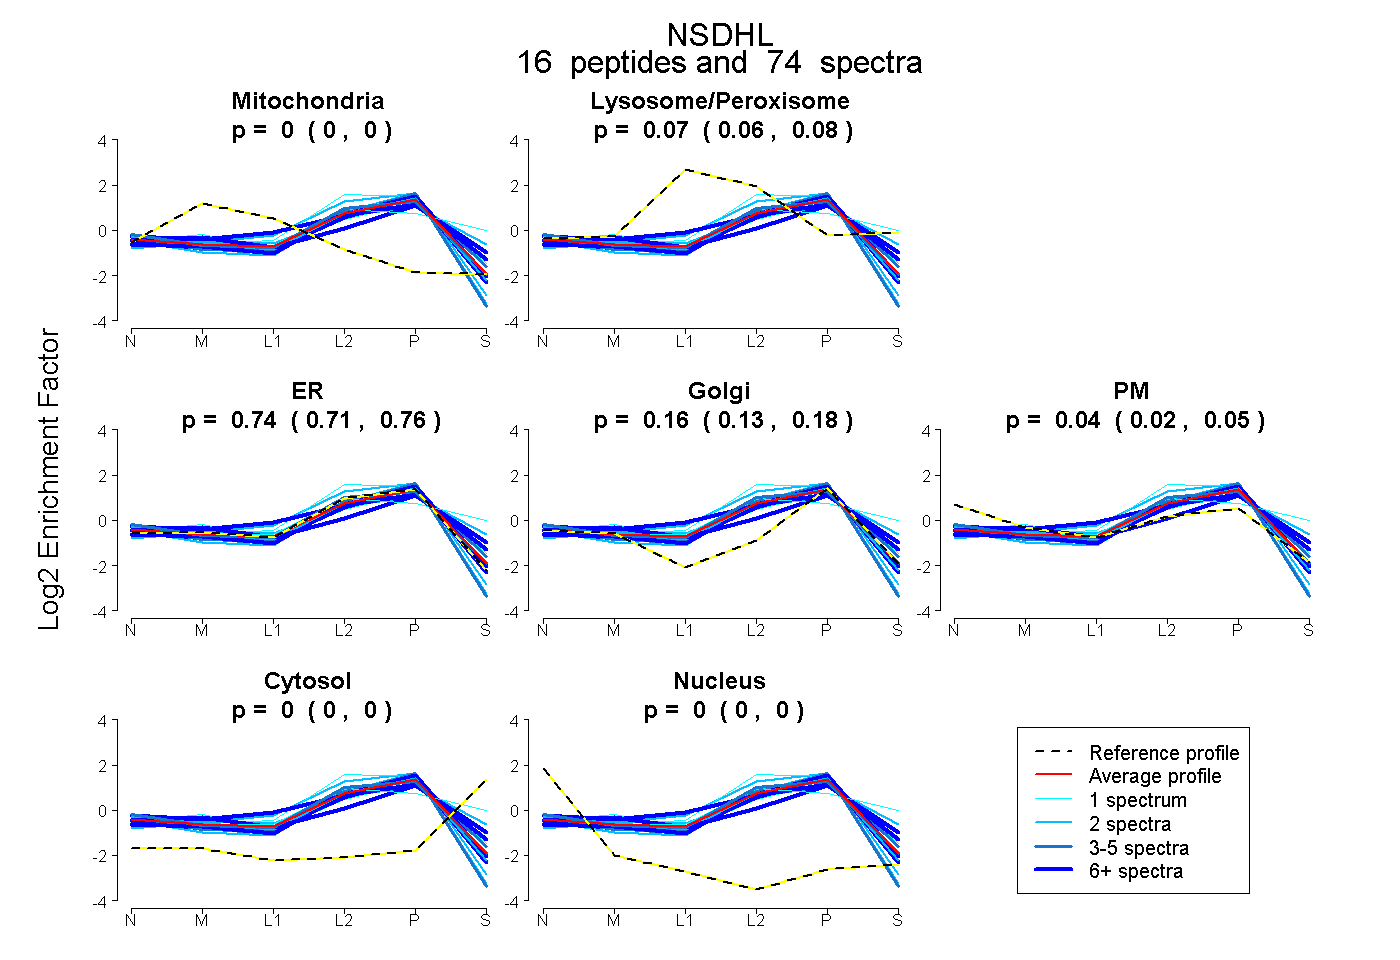
0.000 | 0.000
0.056 | 0.080
0.715 | 0.756
0.132 | 0.175
0.024 | 0.048
0.000 | 0.000
0.000 | 0.000
16peptides
spectra
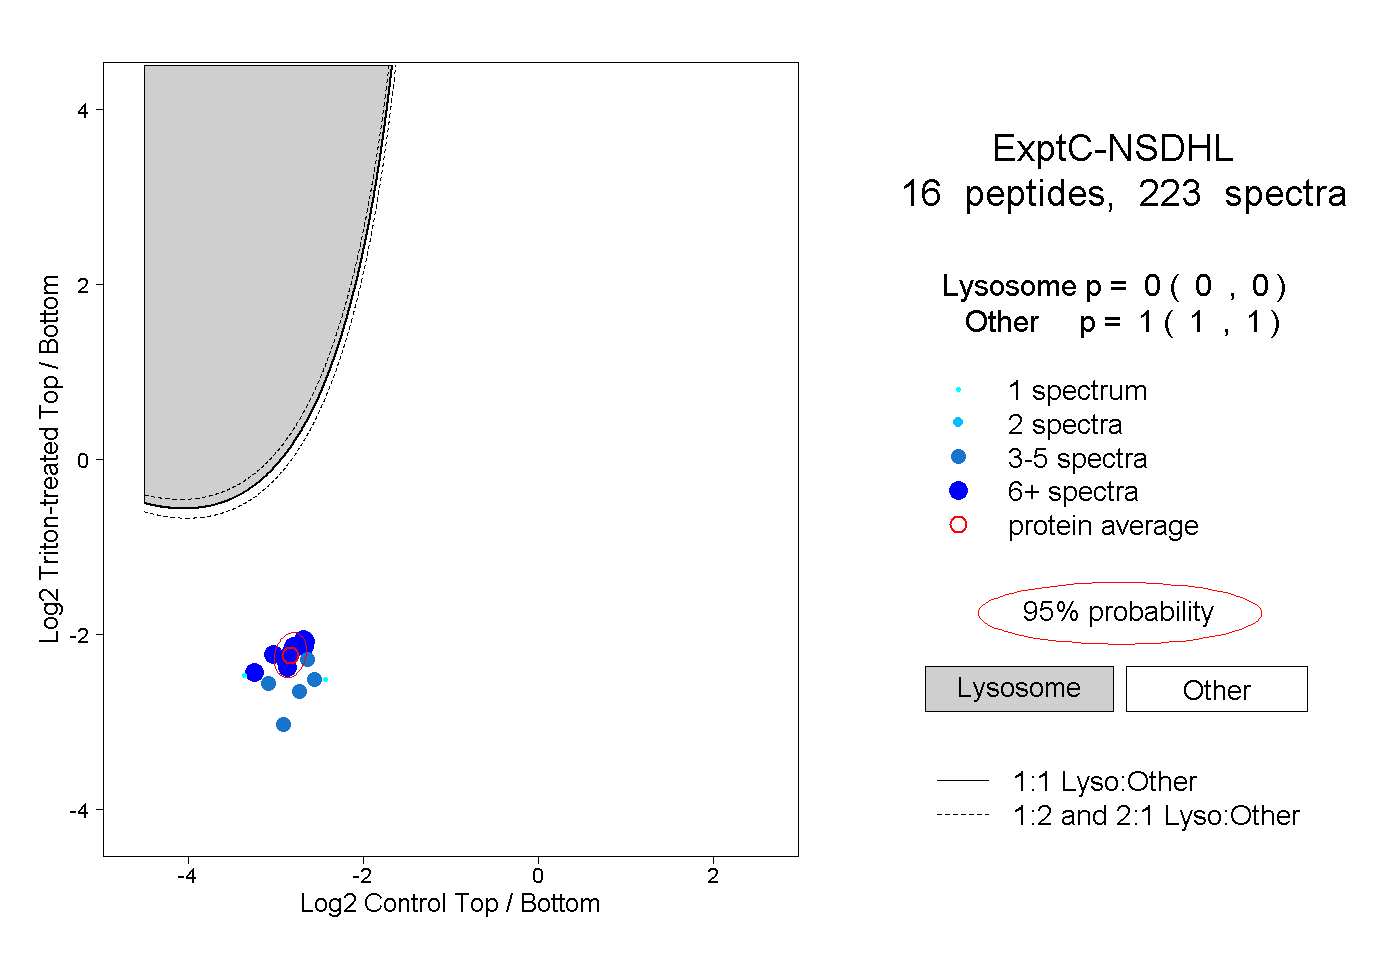
0.000 | 0.000
1.000 | 1.000
7peptides
spectra
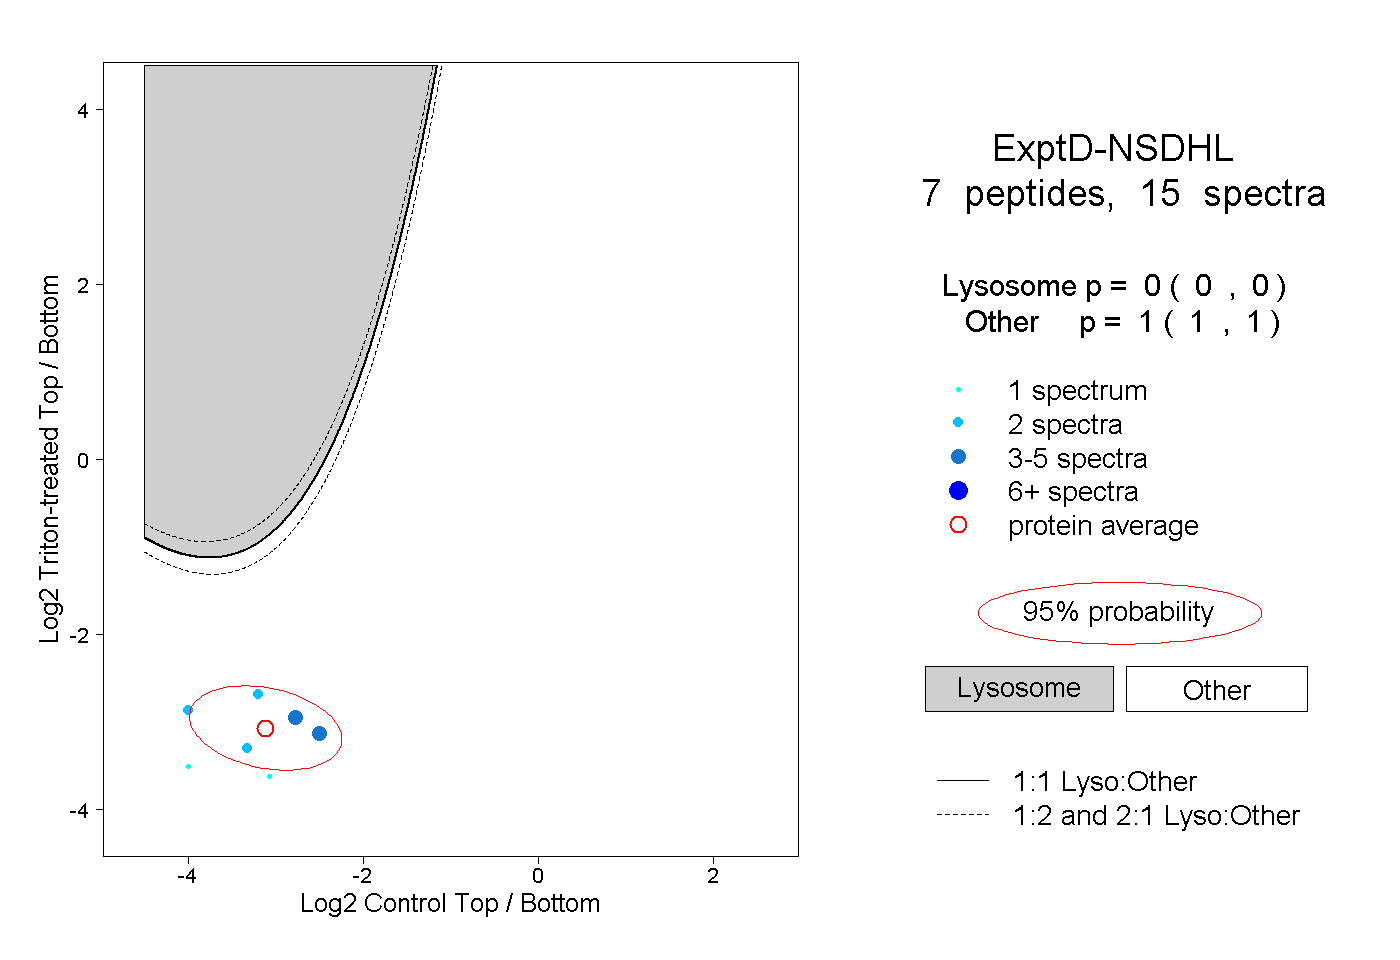
0.000 | 0.000
1.000 | 1.000