13
13peptides
spectra

0.000 | 0.000
0.000 | 0.000
0.254 | 0.269
0.298 | 0.317
0.000 | 0.000
0.417 | 0.440
0.000 | 0.000
0.000 | 0.000
10peptides
spectra
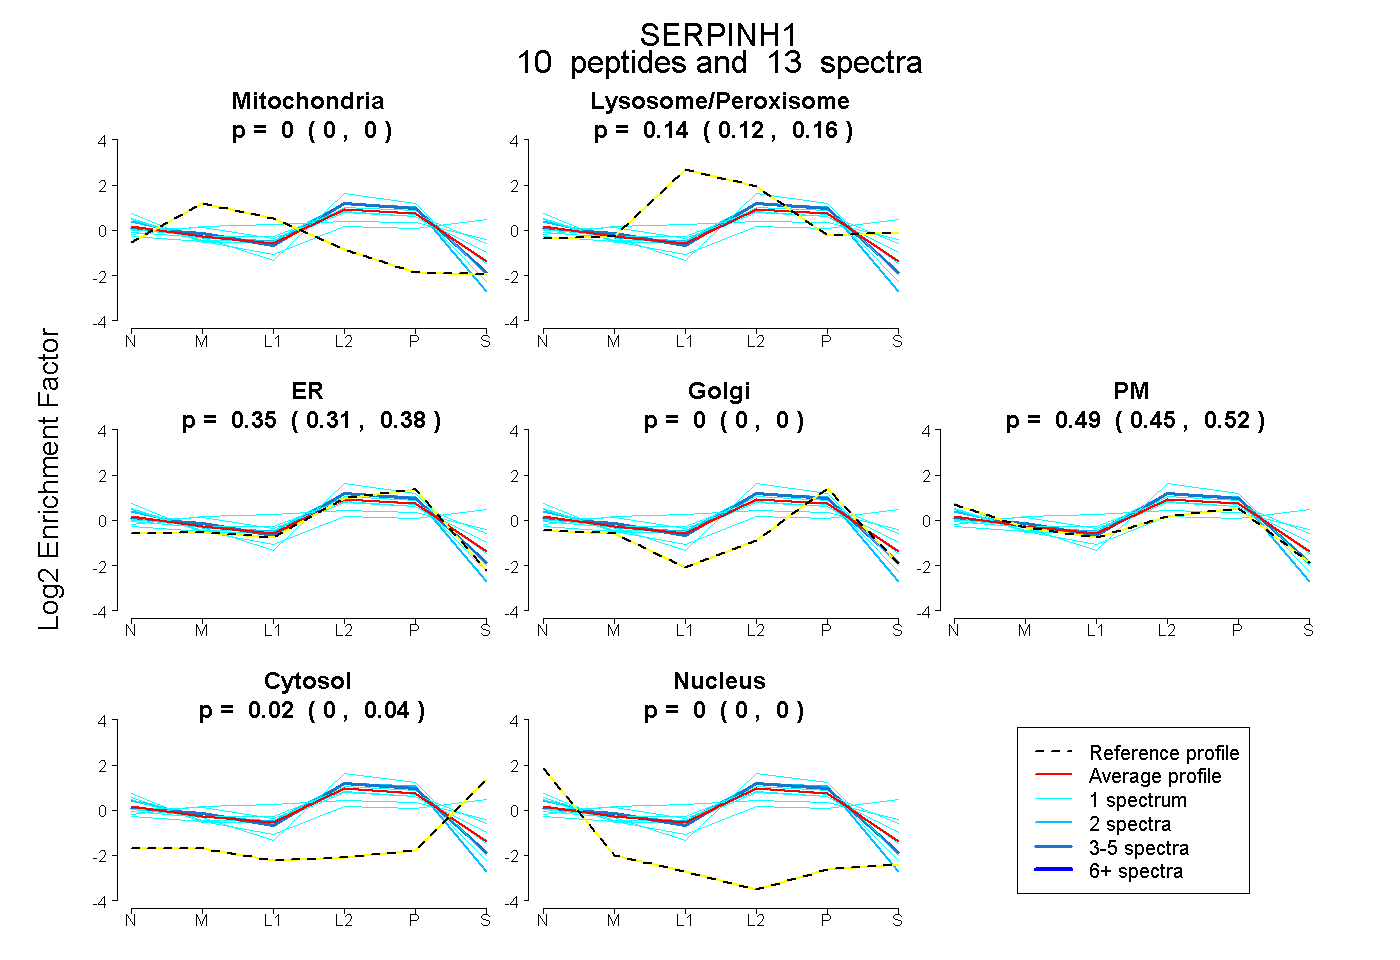
0.000 | 0.000
0.119 | 0.159
0.313 | 0.384
0.000 | 0.000
0.446 | 0.520
0.002 | 0.036
0.000 | 0.000