 1
1peptide
spectra
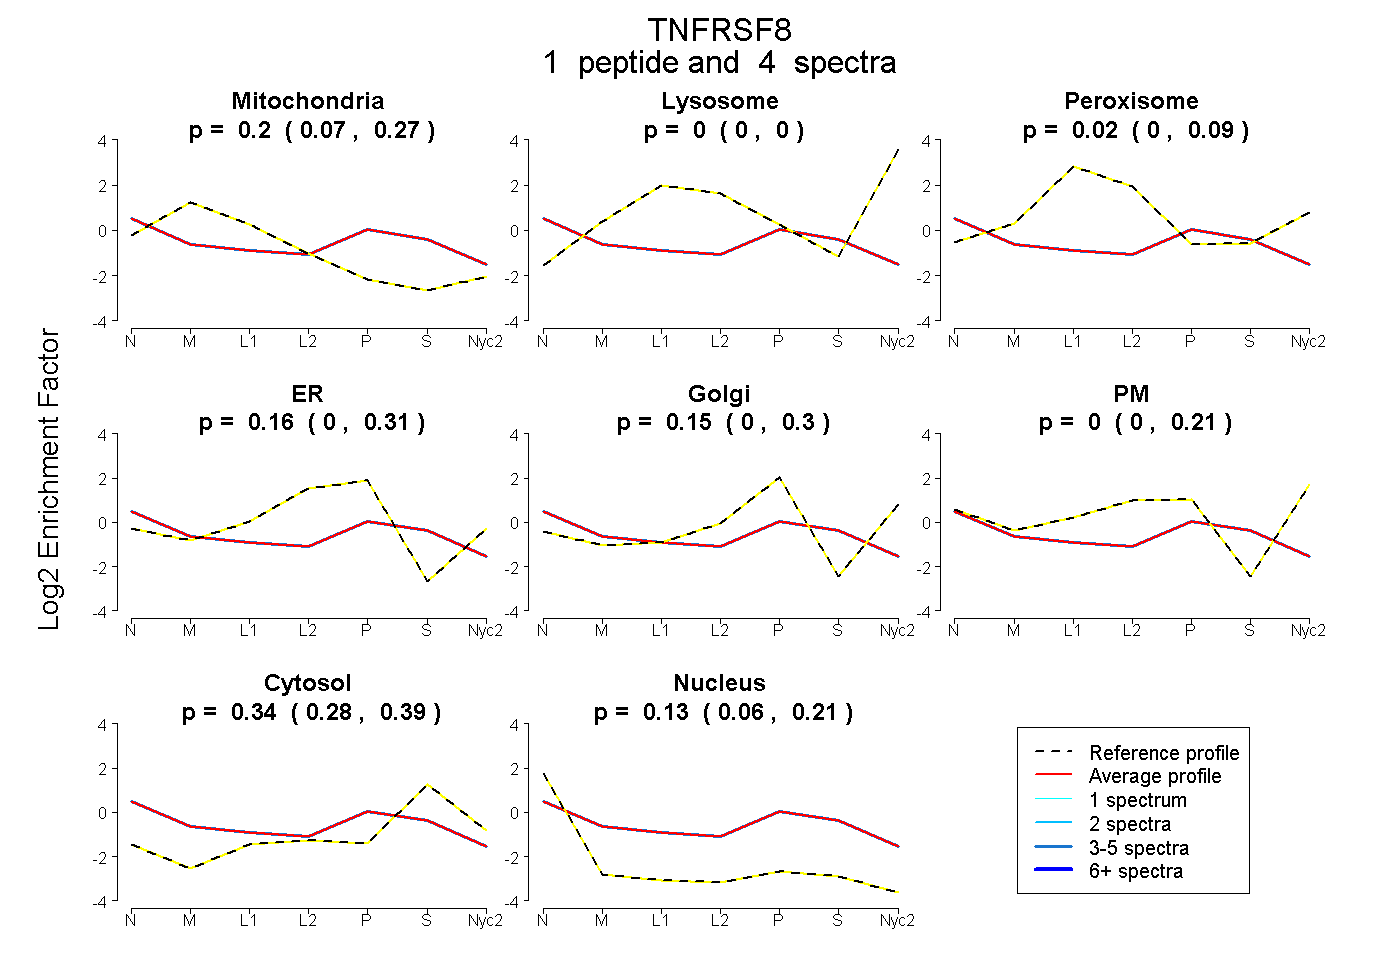
0.066 | 0.270
0.000 | 0.000
0.000 | 0.090
0.000 | 0.314
0.000 | 0.302
0.000 | 0.213
0.278 | 0.393
0.065 | 0.207
1peptide
spectra
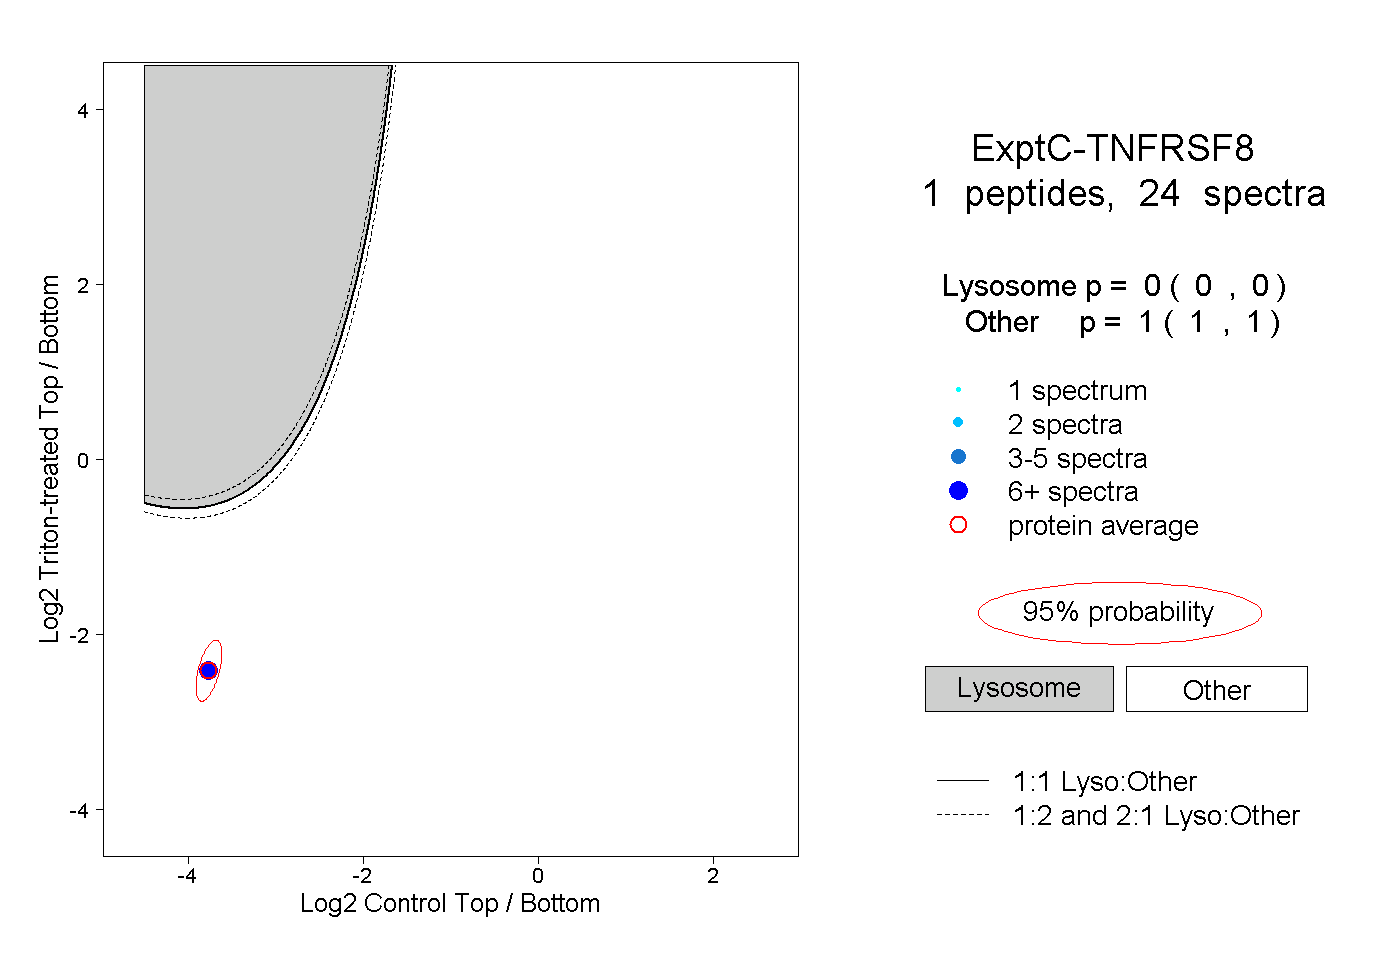
0.000 | 0.000
1.000 | 1.000
1peptide
spectra
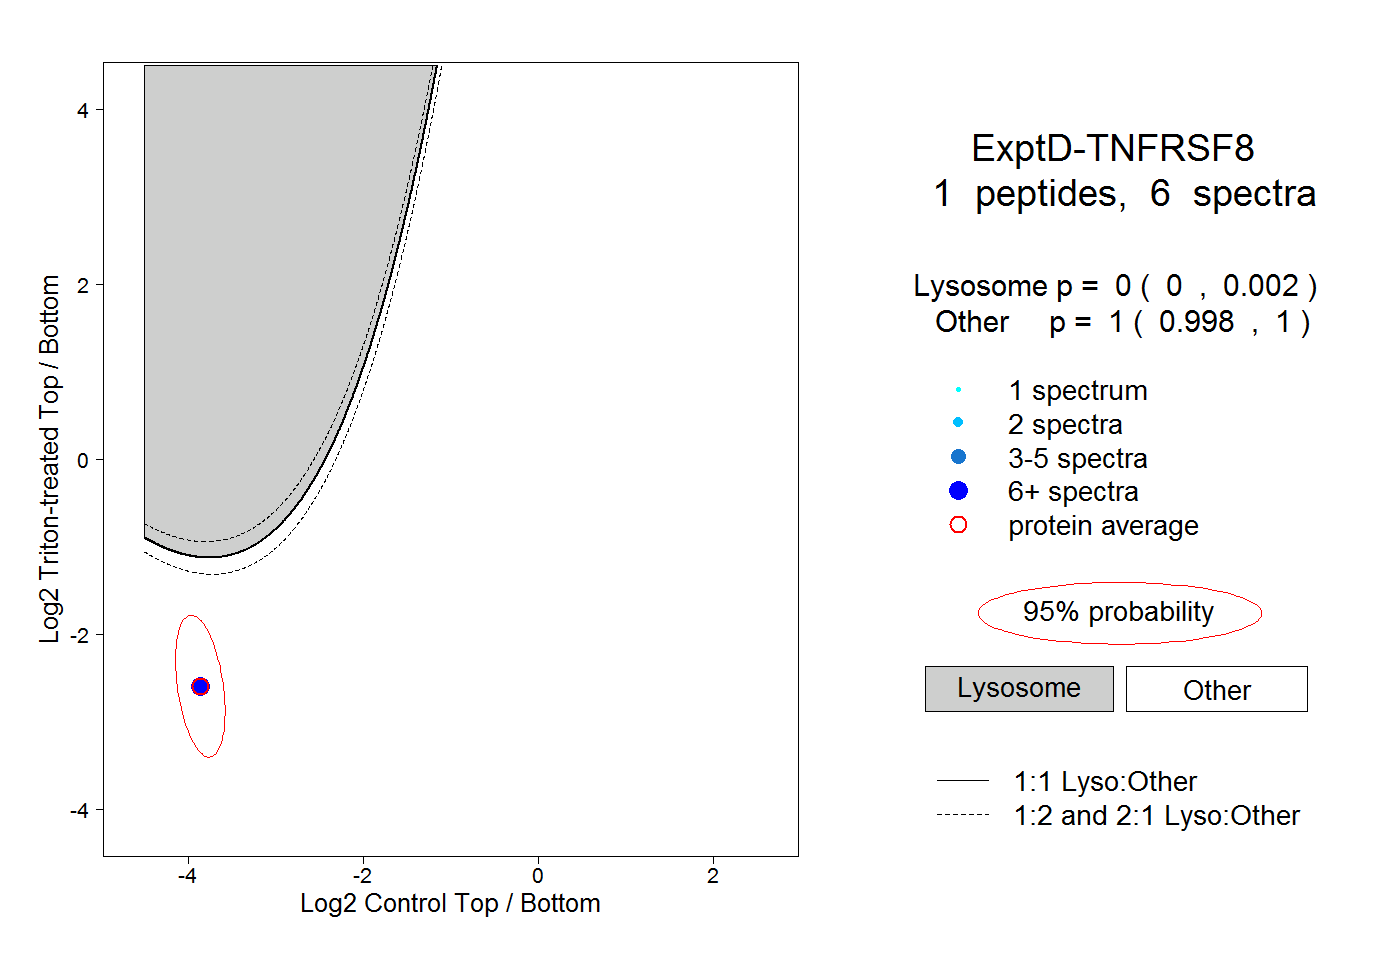
0.000 | 0.002
0.998 | 1.000