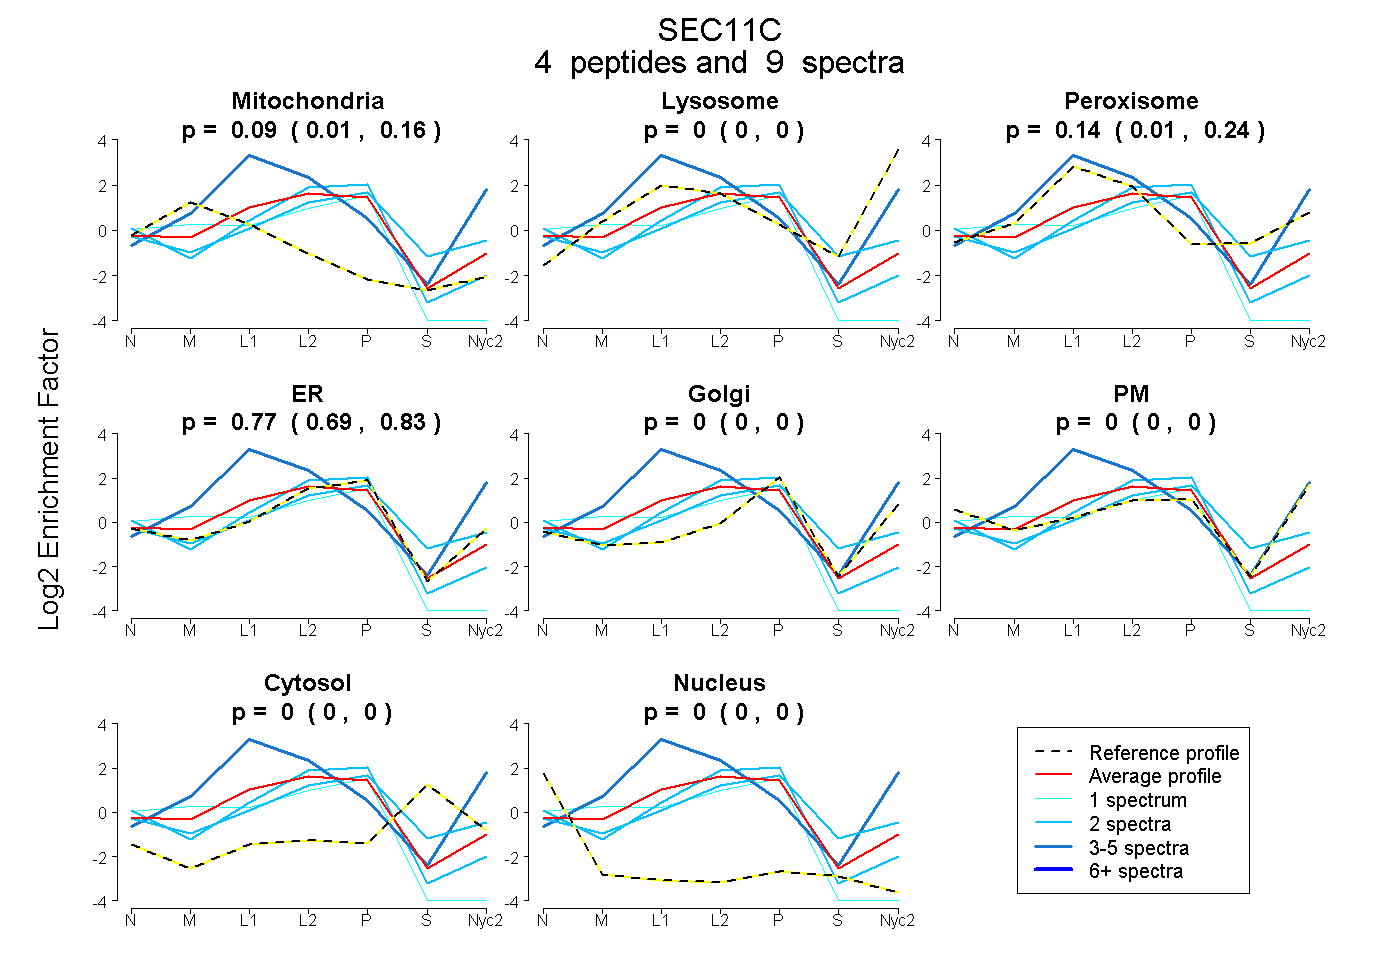
 4
4peptides
spectra
0.010 | 0.165
0.000 | 0.000
0.010 | 0.235
0.688 | 0.832
0.000 | 0.000
0.000 | 0.000
0.000 | 0.000
0.000 | 0.000
| Plot | Mito | Lyso | Perox | ER | Golgi | PM | Cytosol | Nucleus | |||||
| Expt A |
4 peptides |
9 spectra |
|
0.093 0.010 | 0.165 |
0.000 0.000 | 0.000 |
0.138 0.010 | 0.235 |
0.769 0.688 | 0.832 |
0.000 0.000 | 0.000 |
0.000 0.000 | 0.000 |
0.000 0.000 | 0.000 |
0.000 0.000 | 0.000 |
| 4 spectra, DNGDIK | 0.000 | 0.395 | 0.481 | 0.124 | 0.000 | 0.000 | 0.000 | 0.000 | ||
| 2 spectra, AGEIVVFK | 0.000 | 0.000 | 0.000 | 0.940 | 0.000 | 0.000 | 0.000 | 0.060 | ||
| 1 spectrum, AGAVGTHLPTSSLDIFGDLR | 0.304 | 0.000 | 0.000 | 0.618 | 0.000 | 0.000 | 0.000 | 0.077 | ||
| 2 spectra, GDLLFLTNFR | 0.000 | 0.000 | 0.085 | 0.742 | 0.000 | 0.000 | 0.172 | 0.000 |
| Plot | Lyso | Other | |||||||||||
| Expt C |
3 peptides |
9 spectra |
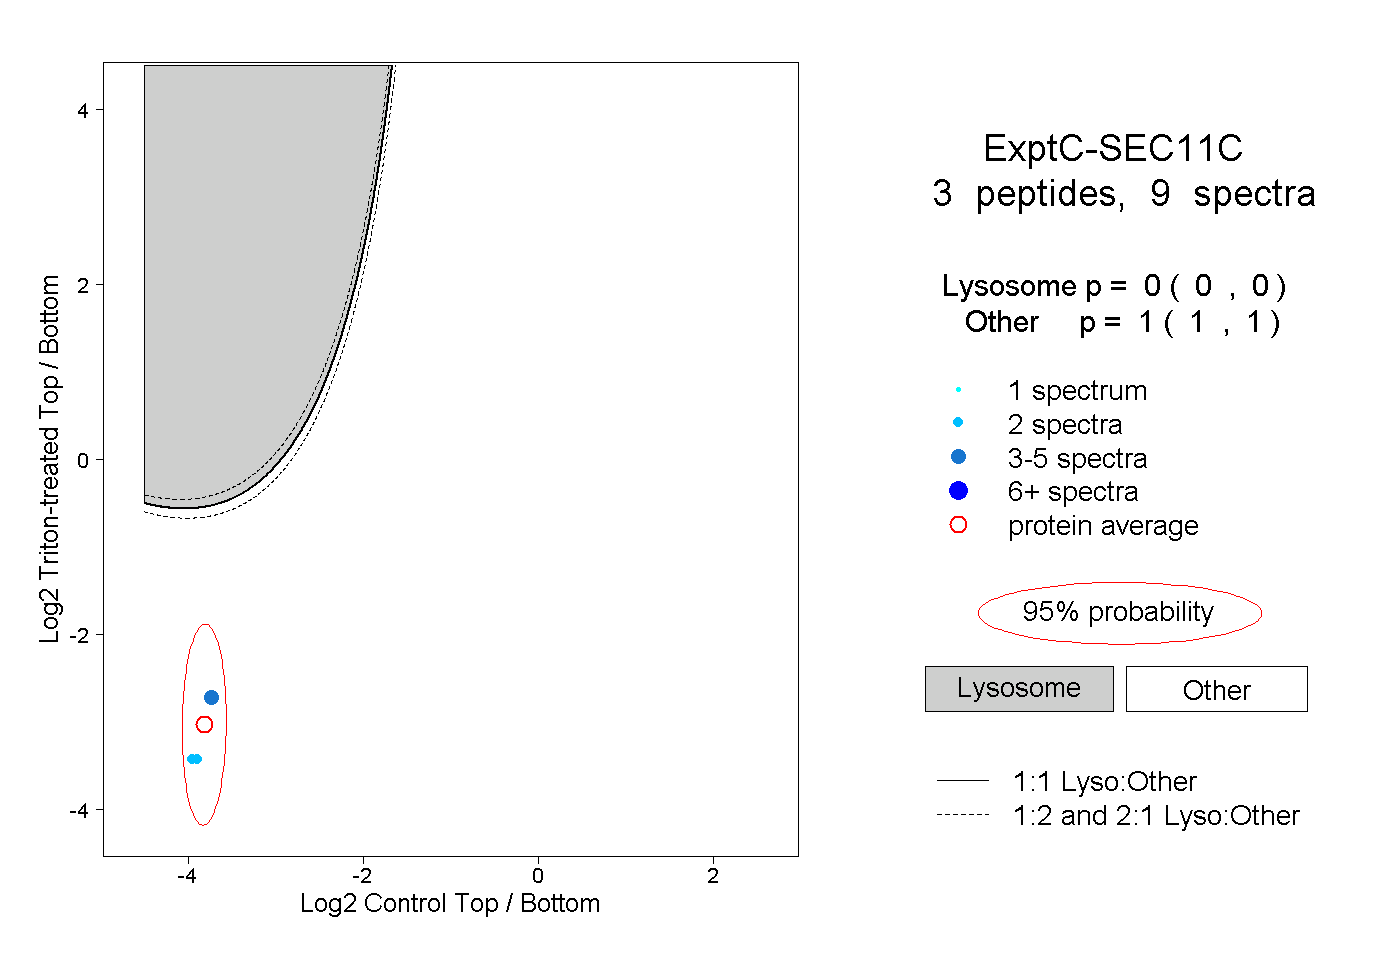 |
0.000 0.000 | 0.000 |
1.000 1.000 | 1.000 |