 2
2peptides
spectra
0.000 | 0.000
0.000 | 0.153
0.000 | 0.000
0.000 | 0.000
0.285 | 0.572
0.248 | 0.598
0.000 | 0.129
0.000 | 0.000
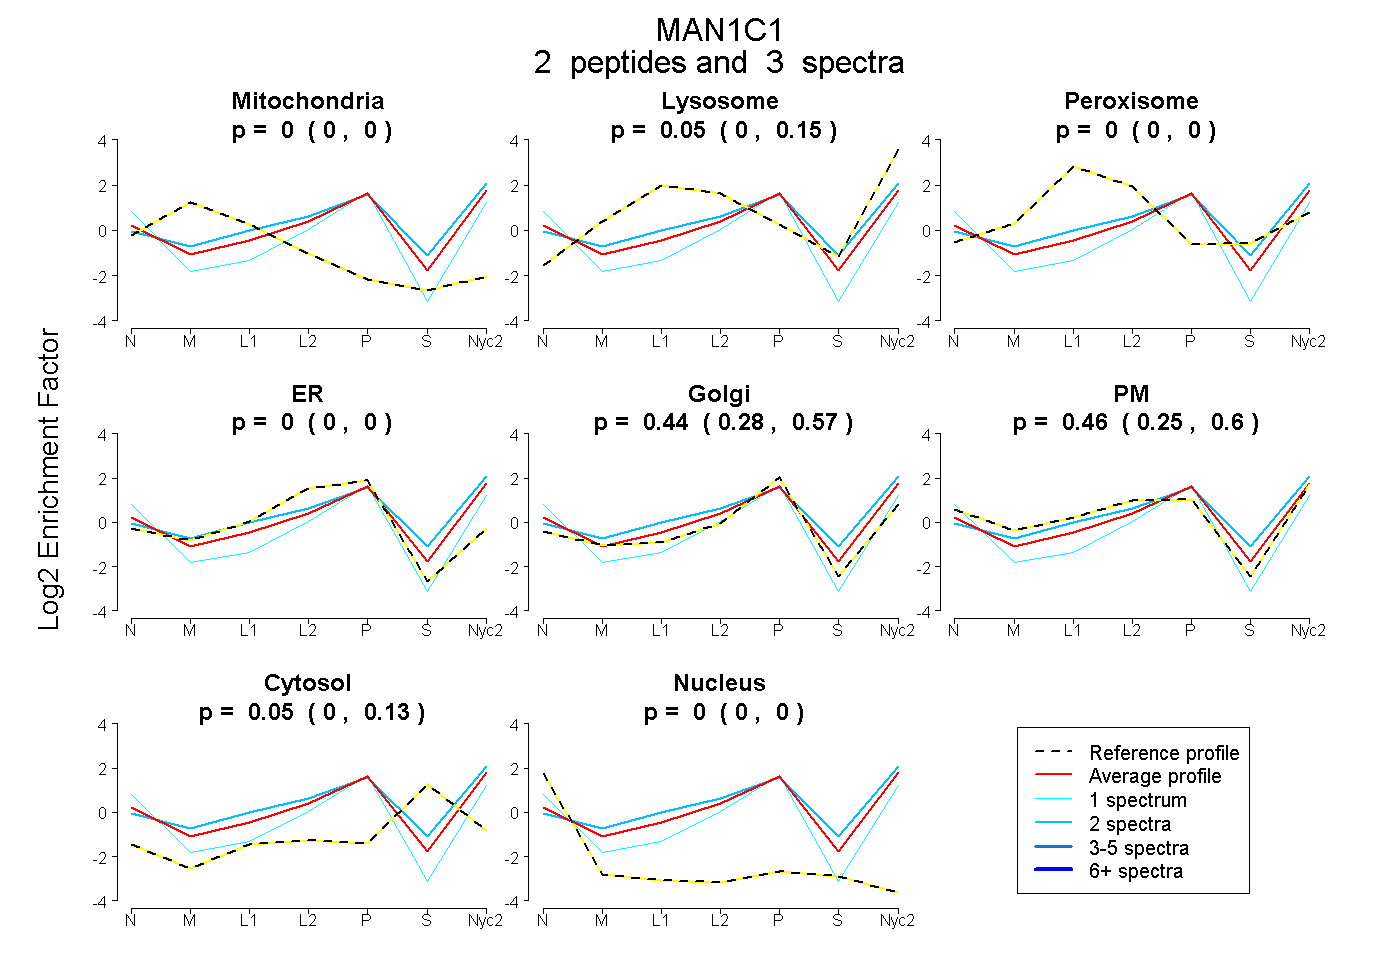
| Plot | Mito | Lyso | Perox | ER | Golgi | PM | Cytosol | Nucleus | |||||
| Expt A |
2 peptides |
3 spectra |
|
0.000 0.000 | 0.000 |
0.052 0.000 | 0.153 |
0.000 0.000 | 0.000 |
0.000 0.000 | 0.000 |
0.441 0.285 | 0.572 |
0.456 0.248 | 0.598 |
0.051 0.000 | 0.129 |
0.000 0.000 | 0.000 |