 4
4peptides
spectra
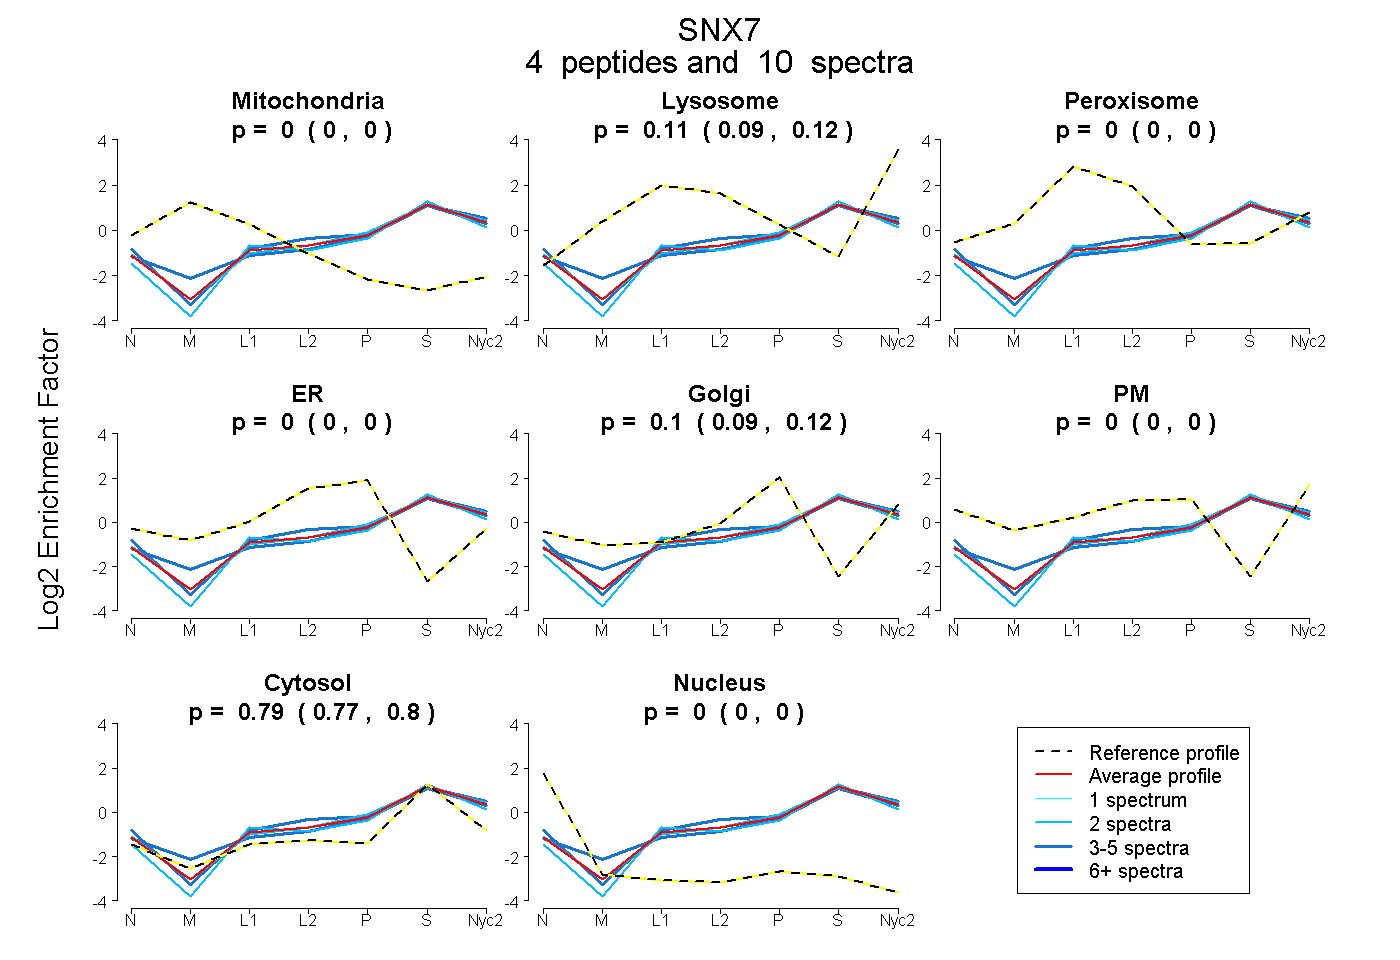
0.000 | 0.000
0.091 | 0.122
0.000 | 0.000
0.000 | 0.000
0.090 | 0.116
0.000 | 0.000
0.774 | 0.800
0.000 | 0.000
| Plot | Mito | Lyso | Perox | ER | Golgi | PM | Cytosol | Nucleus | |||||
| Expt A |
4 peptides |
10 spectra |
|
0.000 0.000 | 0.000 |
0.108 0.091 | 0.122 |
0.000 0.000 | 0.000 |
0.000 0.000 | 0.000 |
0.103 0.090 | 0.116 |
0.000 0.000 | 0.000 |
0.788 0.774 | 0.800 |
0.000 0.000 | 0.000 |
| 2 spectra, GEFDSSEFEVR | 0.000 | 0.081 | 0.000 | 0.000 | 0.043 | 0.000 | 0.876 | 0.000 | ||
| 3 spectra, DQIQAELDSK | 0.000 | 0.122 | 0.000 | 0.000 | 0.119 | 0.000 | 0.759 | 0.000 | ||
| 3 spectra, FEDGPDLK | 0.000 | 0.110 | 0.000 | 0.000 | 0.065 | 0.062 | 0.764 | 0.000 | ||
| 2 spectra, SAFTDTAEENIR | 0.000 | 0.097 | 0.000 | 0.000 | 0.133 | 0.000 | 0.770 | 0.000 |
| Plot | Lyso | Other | |||||||||||
| Expt C |
3 peptides |
9 spectra |
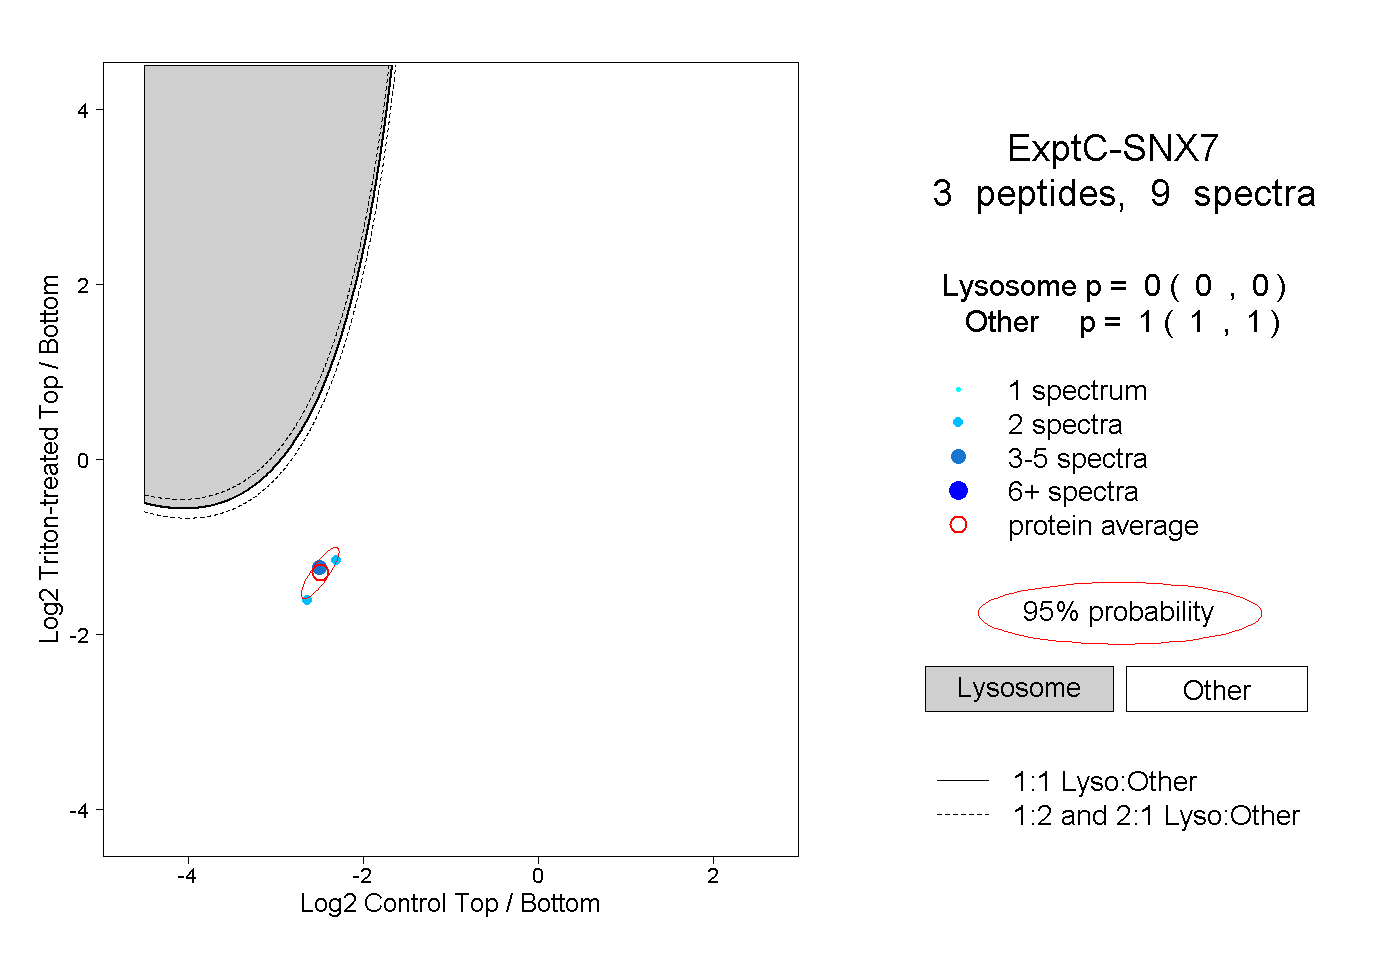 |
0.000 0.000 | 0.000 |
1.000 1.000 | 1.000 |