 3
3peptides
spectra
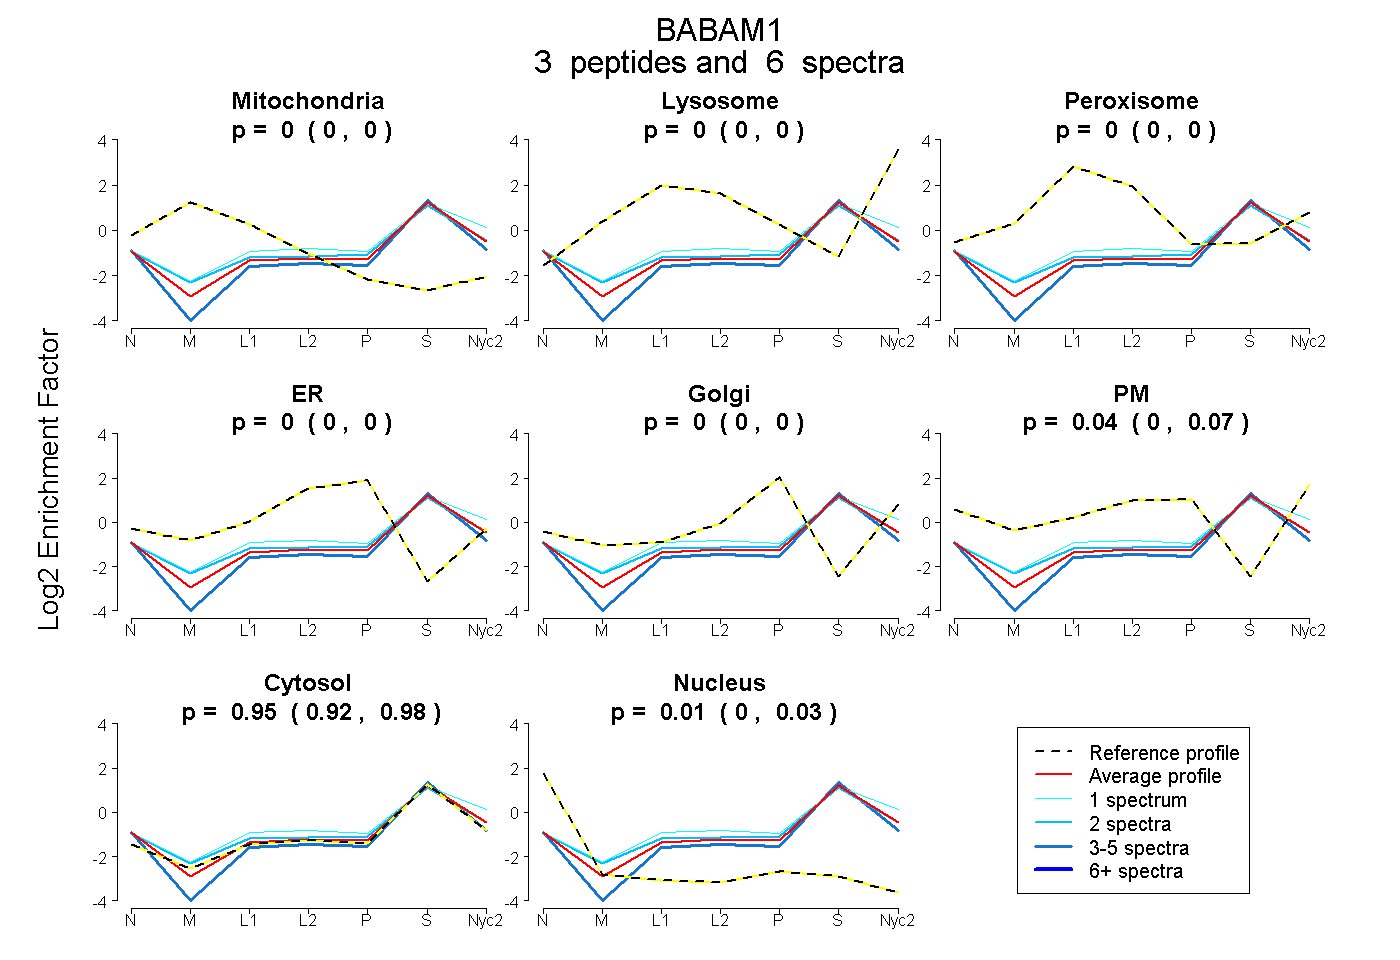
0.000 | 0.000
0.000 | 0.000
0.000 | 0.000
0.000 | 0.000
0.000 | 0.000
0.003 | 0.065
0.924 | 0.976
0.000 | 0.026
2peptides
spectra
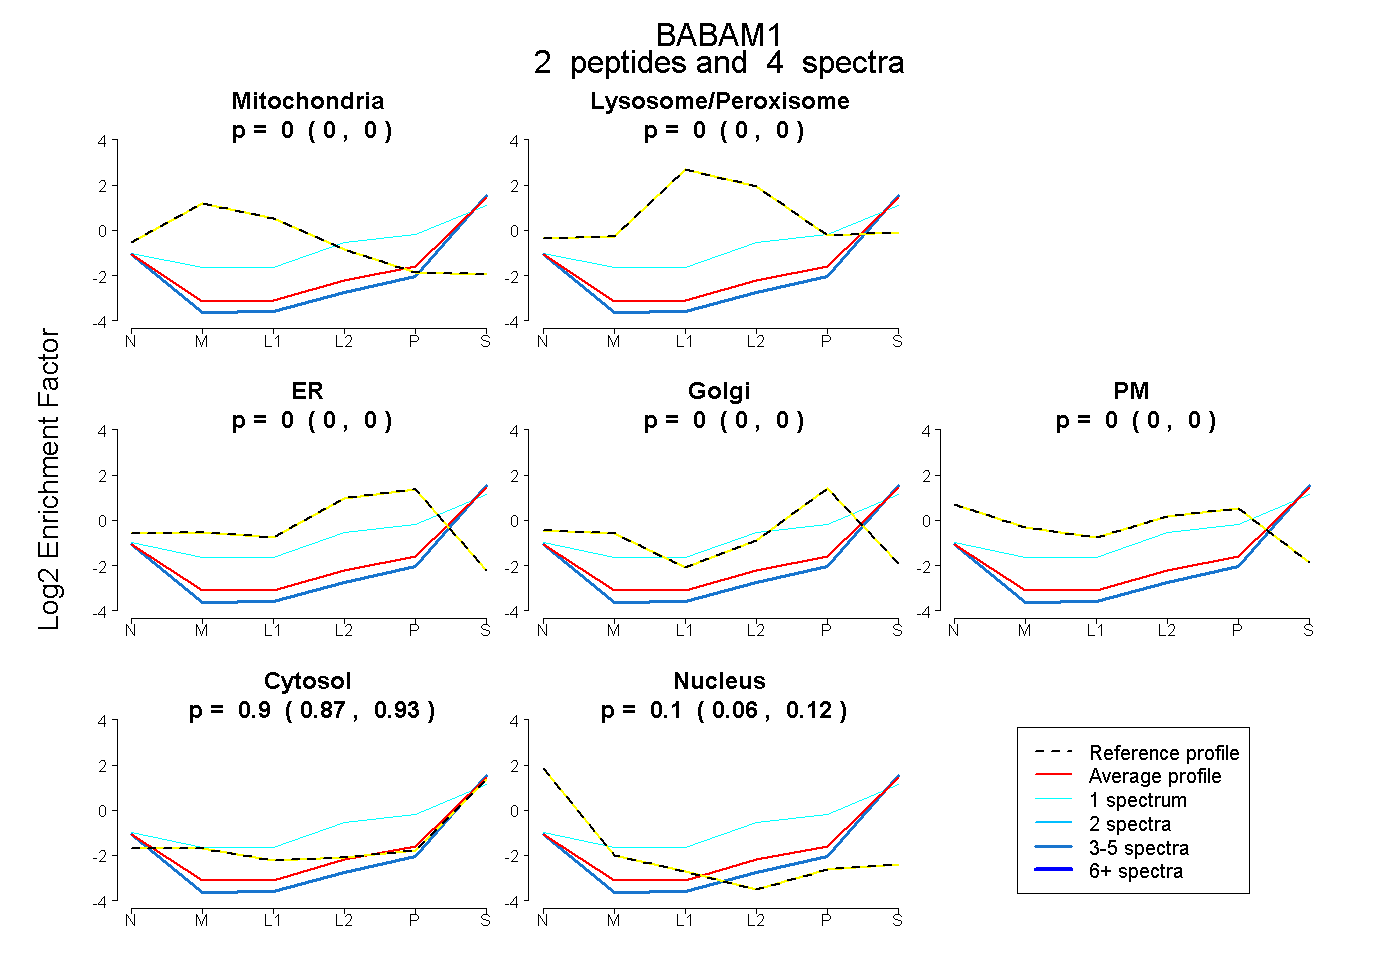
0.000 | 0.000
0.000 | 0.000
0.000 | 0.000
0.000 | 0.000
0.000 | 0.000
0.871 | 0.929
0.060 | 0.124
2peptides
spectra
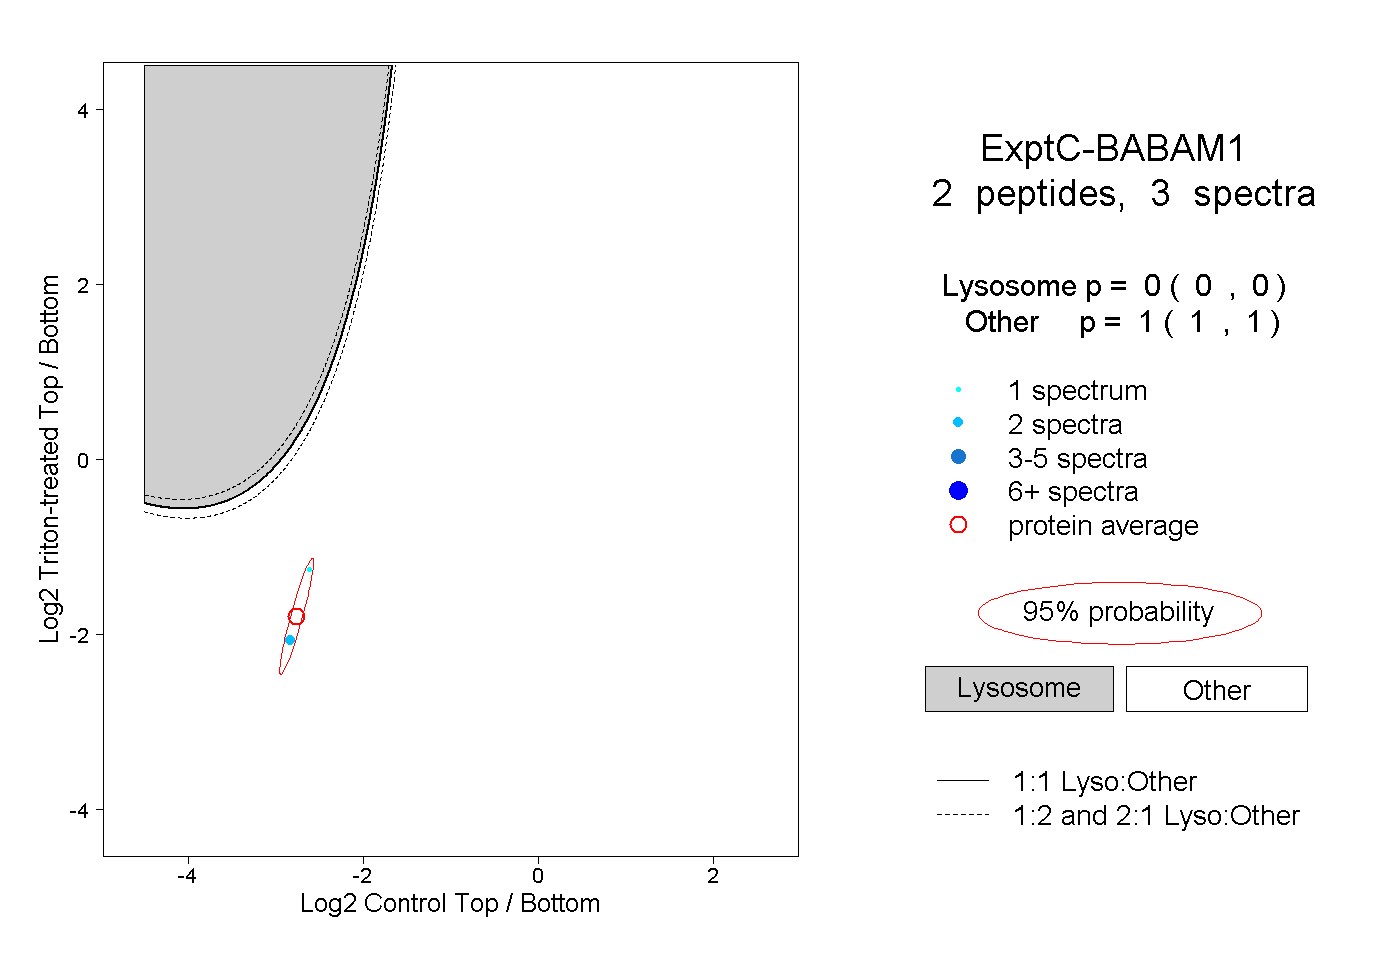
0.000 | 0.000
1.000 | 1.000