 1
1peptide
spectrum
NA | NA
NA | NA
NA | NA
NA | NA
NA | NA
NA | NA
NA | NA
NA | NA
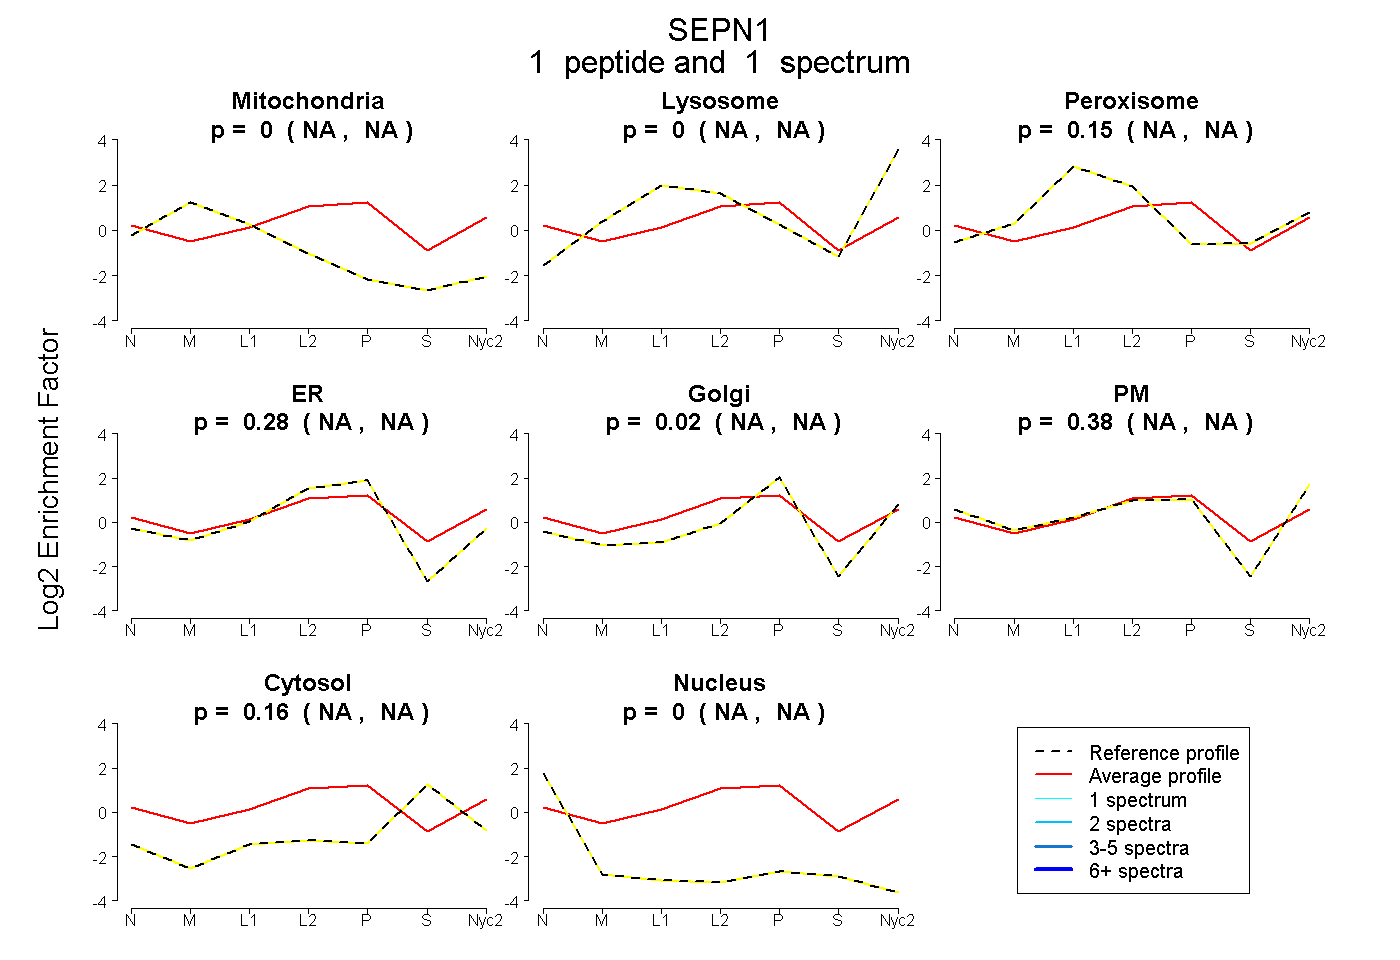
| Plot | Mito | Lyso | Perox | ER | Golgi | PM | Cytosol | Nucleus | |||||
| Expt A |
1 peptide |
1 spectrum |
|
0.000 NA | NA |
0.000 NA | NA |
0.154 NA | NA |
0.284 NA | NA |
0.021 NA | NA |
0.380 NA | NA |
0.161 NA | NA |
0.000 NA | NA |
| 1 spectrum, LFVPNHR | 0.000 | 0.000 | 0.154 | 0.284 | 0.021 | 0.380 | 0.161 | 0.000 |