 5
5peptides
spectra
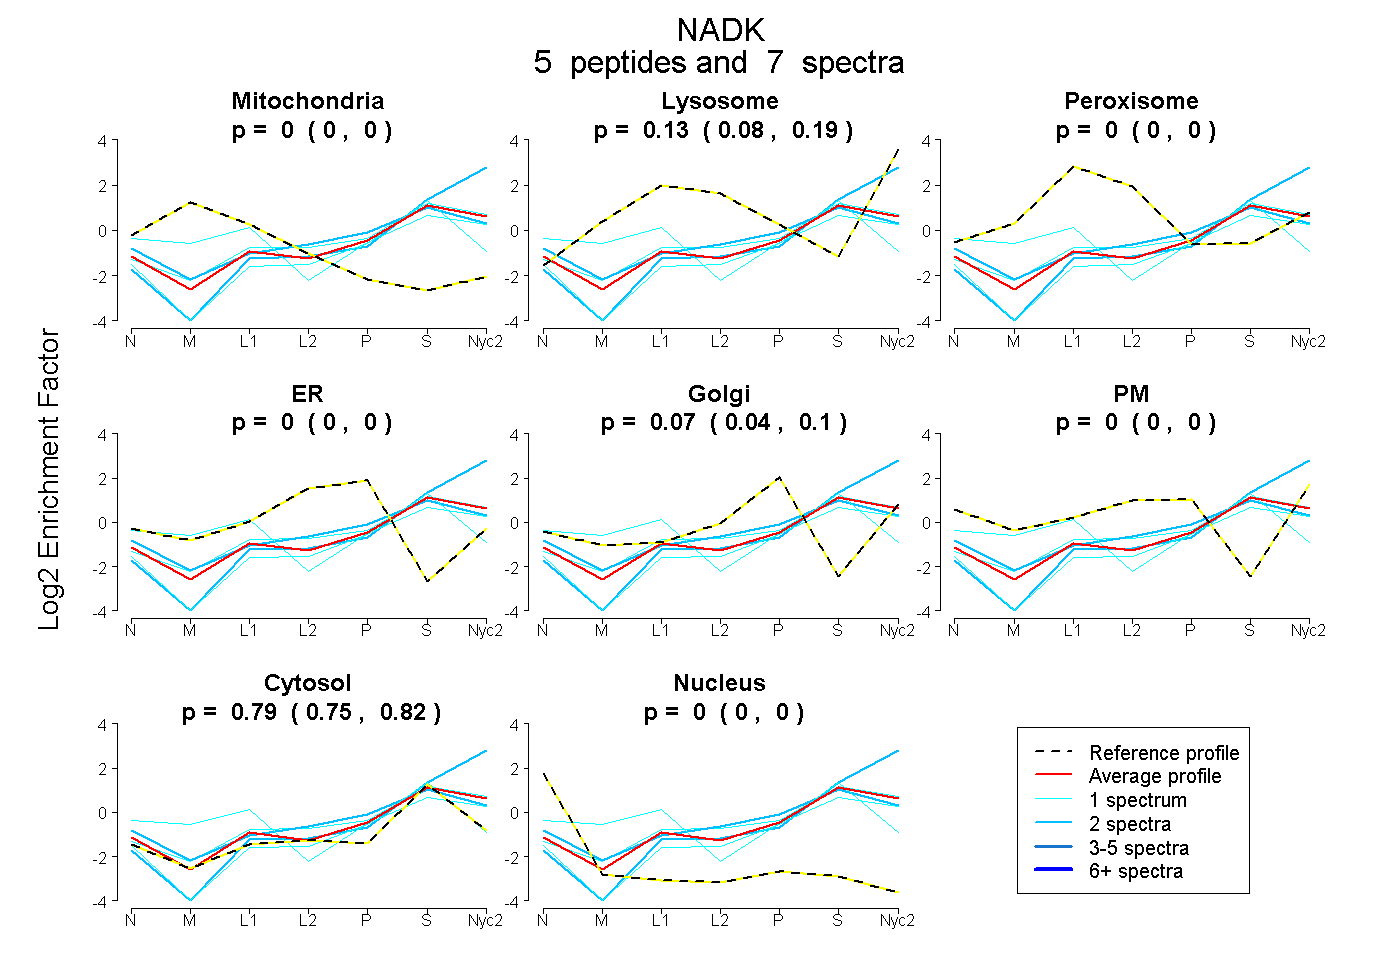
0.000 | 0.000
0.078 | 0.189
0.000 | 0.000
0.000 | 0.000
0.035 | 0.104
0.000 | 0.000
0.752 | 0.823
0.000 | 0.000
3peptides
spectra
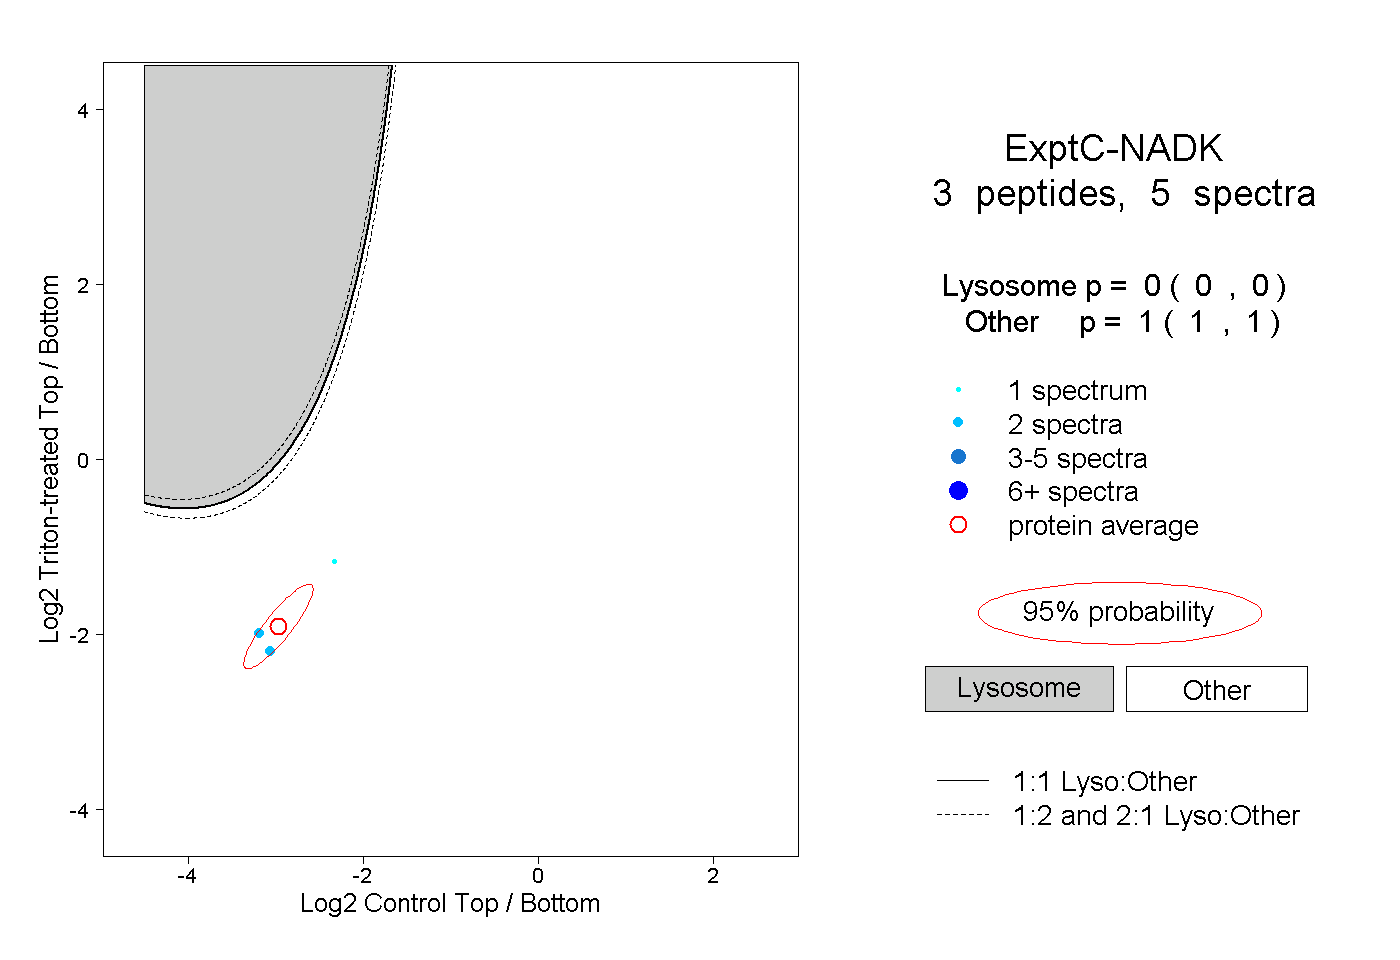
0.000 | 0.000
1.000 | 1.000
| Plot | Mito | Lyso | Perox | ER | Golgi | PM | Cytosol | Nucleus | |||||
| Expt A |
5 peptides |
7 spectra |
|
0.000 0.000 | 0.000 |
0.134 0.078 | 0.189 |
0.000 0.000 | 0.000 |
0.000 0.000 | 0.000 |
0.074 0.035 | 0.104 |
0.000 0.000 | 0.000 |
0.792 0.752 | 0.823 |
0.000 0.000 | 0.000 |
||
| Plot | Lyso | Other | |||||||||||
| Expt C |
3 peptides |
5 spectra |
|
0.000 0.000 | 0.000 |
1.000 1.000 | 1.000 |