 3
3peptides
spectra
0.000 | 0.130
0.000 | 0.000
0.000 | 0.214
0.000 | 0.348
0.000 | 0.019
0.000 | 0.254
0.113 | 0.396
0.261 | 0.499
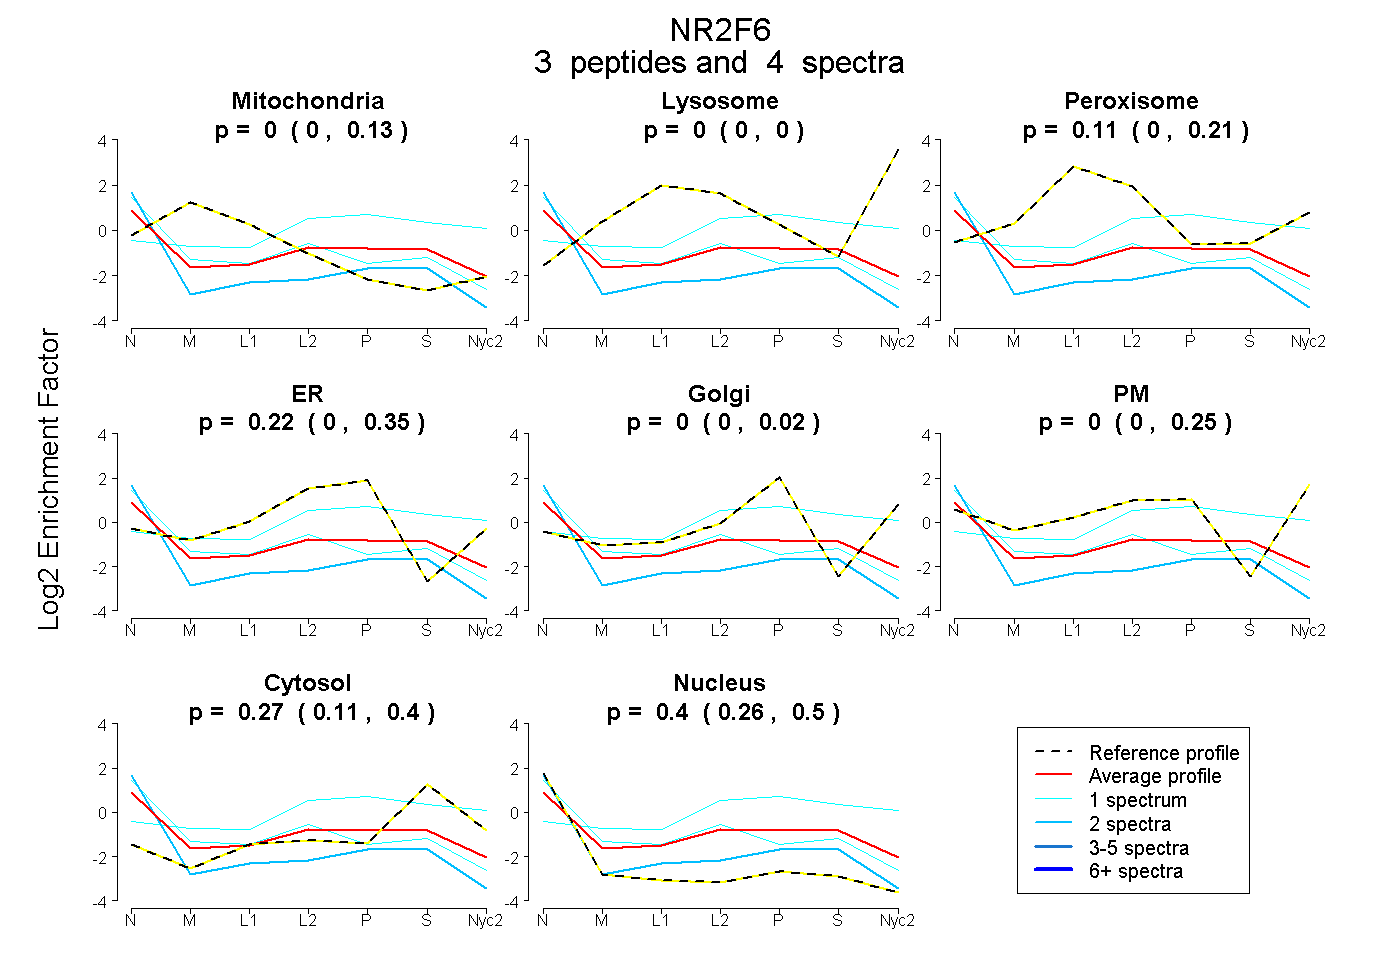
| Plot | Mito | Lyso | Perox | ER | Golgi | PM | Cytosol | Nucleus | |||||
| Expt A |
3 peptides |
4 spectra |
|
0.000 0.000 | 0.130 |
0.000 0.000 | 0.000 |
0.108 0.000 | 0.214 |
0.225 0.000 | 0.348 |
0.000 0.000 | 0.019 |
0.000 0.000 | 0.254 |
0.267 0.113 | 0.396 |
0.401 0.261 | 0.499 |
| 2 spectra, AQYPSQPQR | 0.000 | 0.000 | 0.000 | 0.095 | 0.000 | 0.000 | 0.155 | 0.750 | ||
| 1 spectrum, AGGSYPR | 0.000 | 0.065 | 0.066 | 0.266 | 0.036 | 0.123 | 0.444 | 0.000 | ||
| 1 spectrum, AEPYPAAGR | 0.000 | 0.000 | 0.273 | 0.088 | 0.000 | 0.000 | 0.067 | 0.571 |