 29
29peptides
spectra
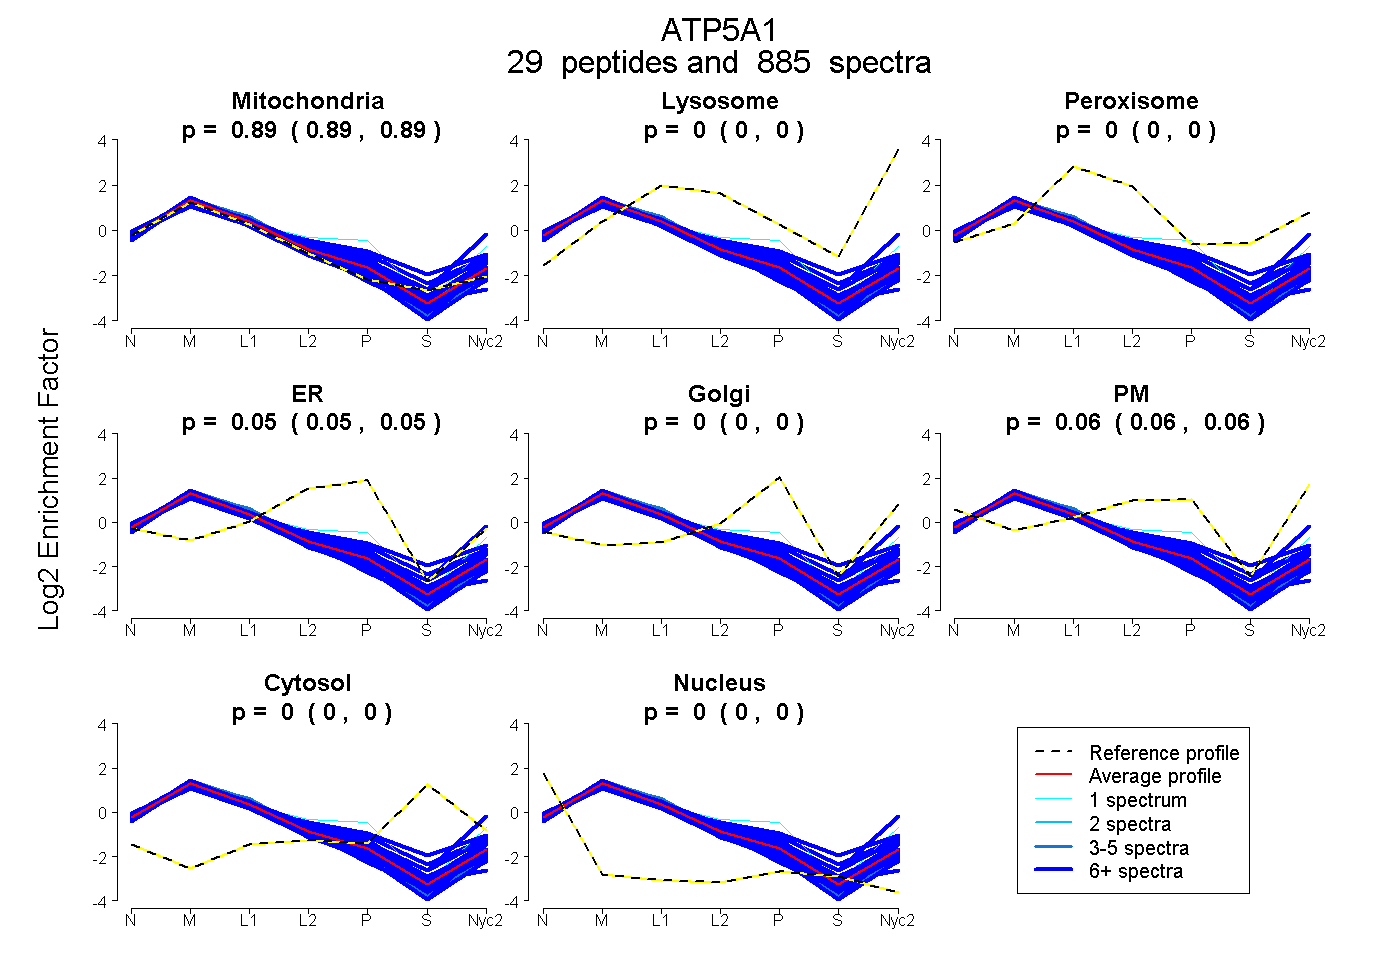
0.893 | 0.894
0.000 | 0.000
0.000 | 0.000
0.046 | 0.049
0.000 | 0.000
0.056 | 0.060
0.000 | 0.000
0.000 | 0.000
28peptides
spectra
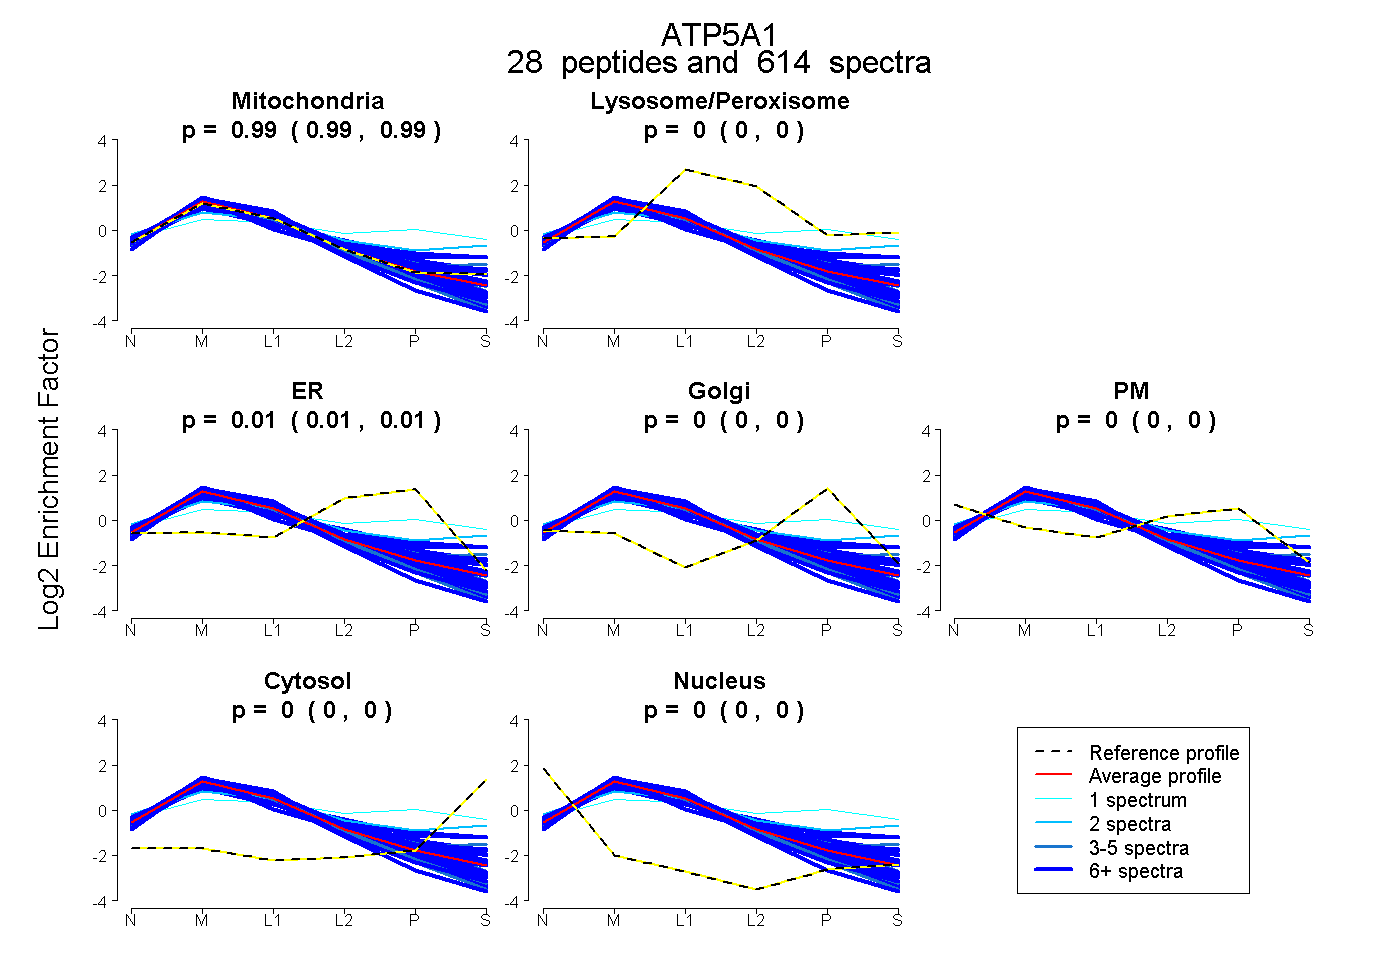
0.986 | 0.988
0.000 | 0.000
0.012 | 0.014
0.000 | 0.000
0.000 | 0.000
0.000 | 0.000
0.000 | 0.000
29peptides
spectra
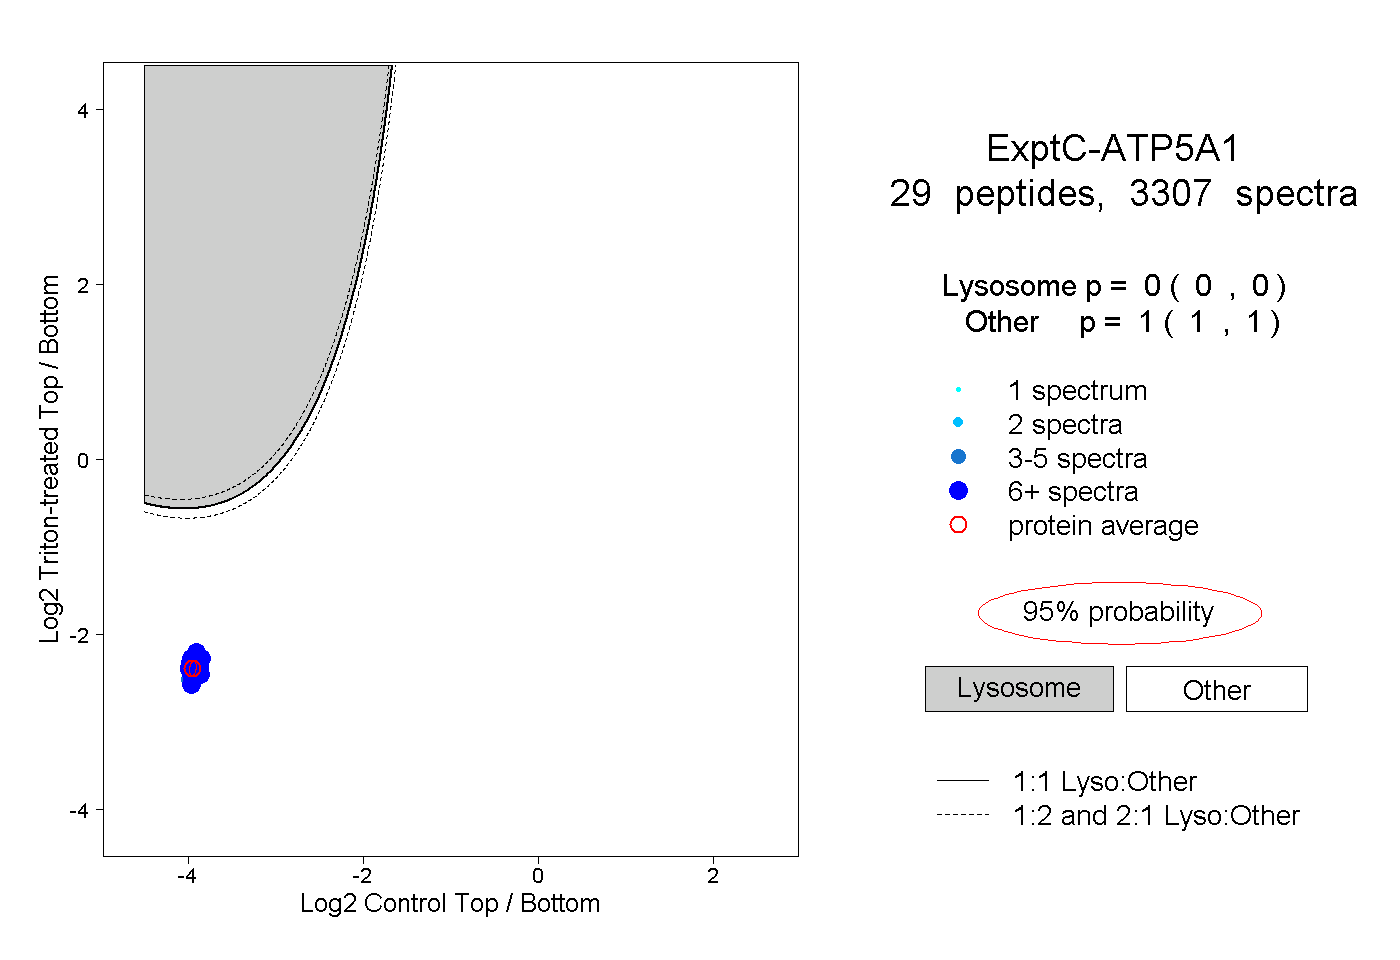
0.000 | 0.000
1.000 | 1.000
26peptides
spectra
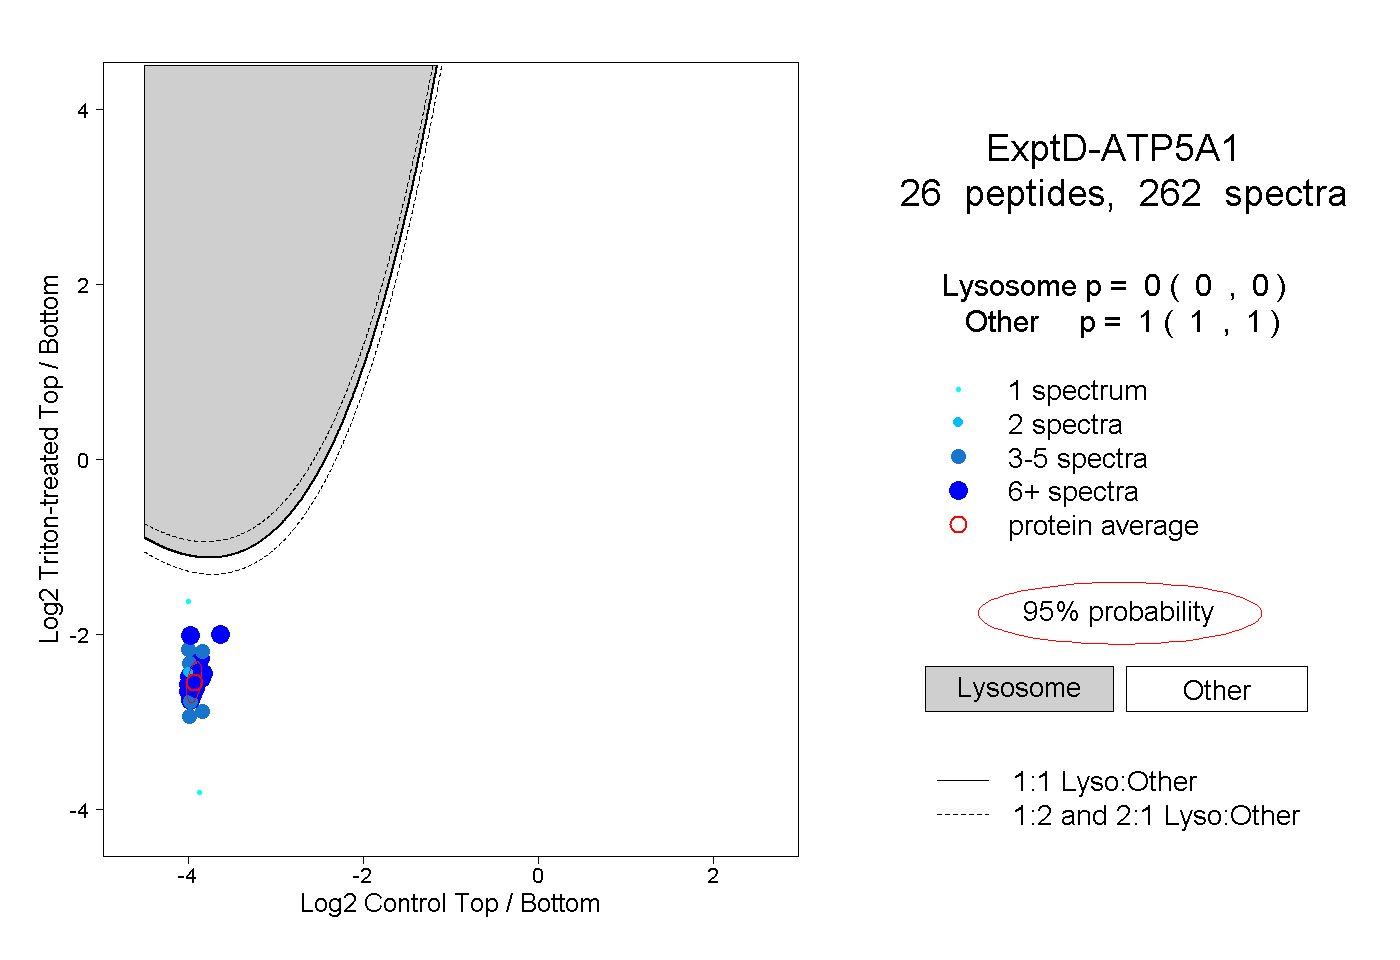
0.000 | 0.000
1.000 | 1.000