 5
5peptides
spectra
0.000 | 0.000
0.000 | 0.000
0.000 | 0.000
0.075 | 0.130
0.392 | 0.451
0.000 | 0.000
0.448 | 0.468
0.003 | 0.017
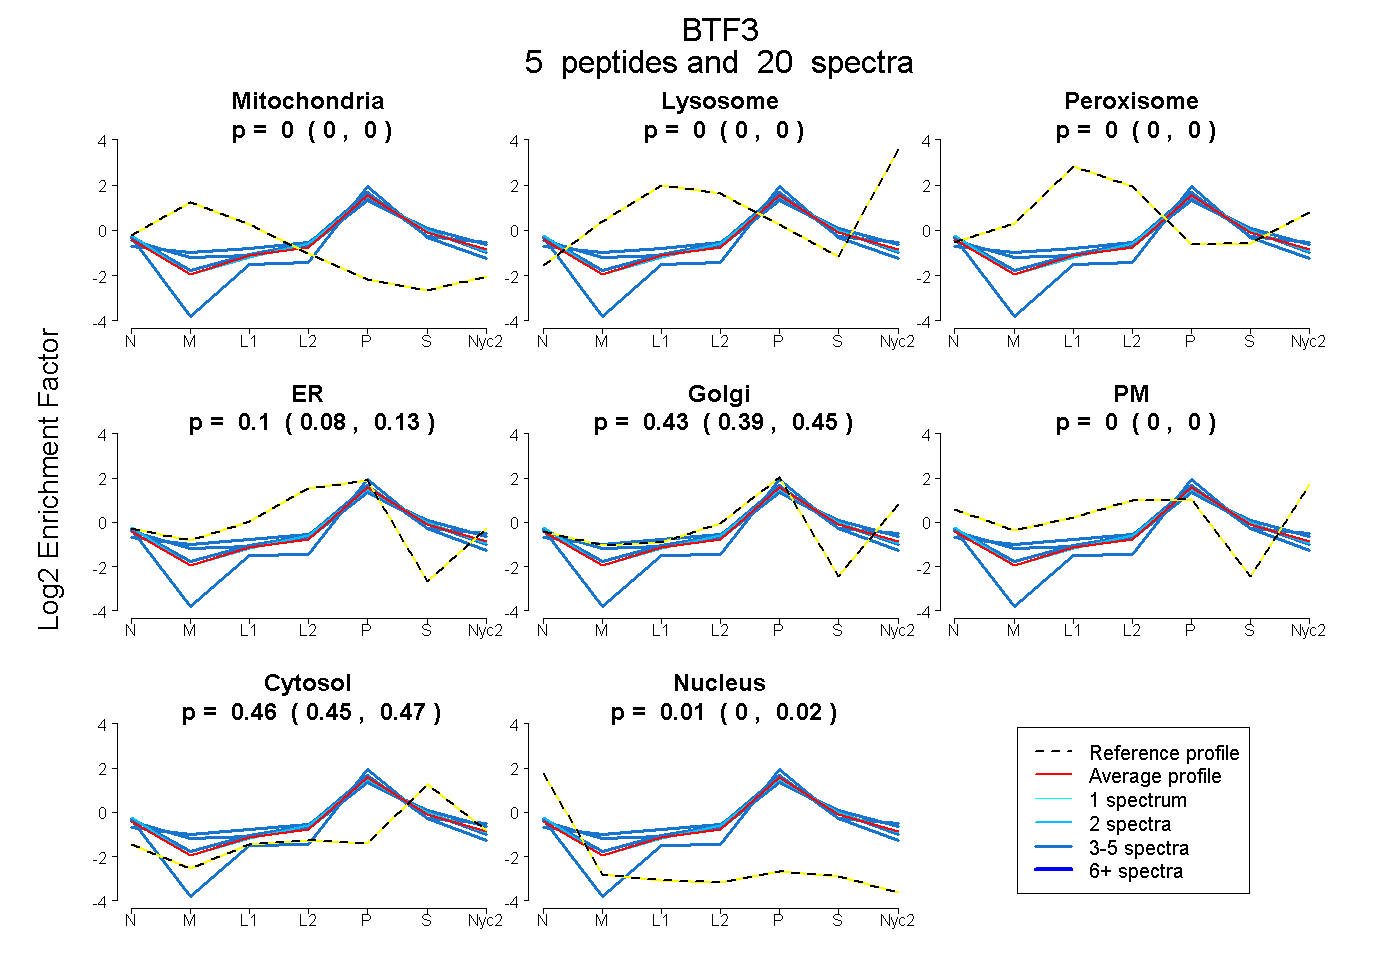
| Plot | Mito | Lyso | Perox | ER | Golgi | PM | Cytosol | Nucleus | |||||
| Expt A |
5 peptides |
20 spectra |
|
0.000 0.000 | 0.000 |
0.000 0.000 | 0.000 |
0.000 0.000 | 0.000 |
0.105 0.075 | 0.130 |
0.426 0.392 | 0.451 |
0.000 0.000 | 0.000 |
0.459 0.448 | 0.468 |
0.011 0.003 | 0.017 |
| 4 spectra, LQFSLK | 0.000 | 0.000 | 0.000 | 0.100 | 0.498 | 0.000 | 0.402 | 0.000 | ||
| 2 spectra, TATADDK | 0.000 | 0.000 | 0.000 | 0.178 | 0.339 | 0.000 | 0.466 | 0.017 | ||
| 4 spectra, LAEALPK | 0.000 | 0.000 | 0.000 | 0.000 | 0.446 | 0.000 | 0.437 | 0.117 | ||
| 5 spectra, ETIMNQEK | 0.000 | 0.000 | 0.007 | 0.211 | 0.328 | 0.000 | 0.454 | 0.000 | ||
| 5 spectra, LQAQVR | 0.000 | 0.000 | 0.000 | 0.197 | 0.327 | 0.000 | 0.466 | 0.010 |
| Plot | Mito | Lyso or Perox | ER | Golgi | PM | Cytosol | Nucleus | ||||||
| Expt B |
2 peptides |
5 spectra |
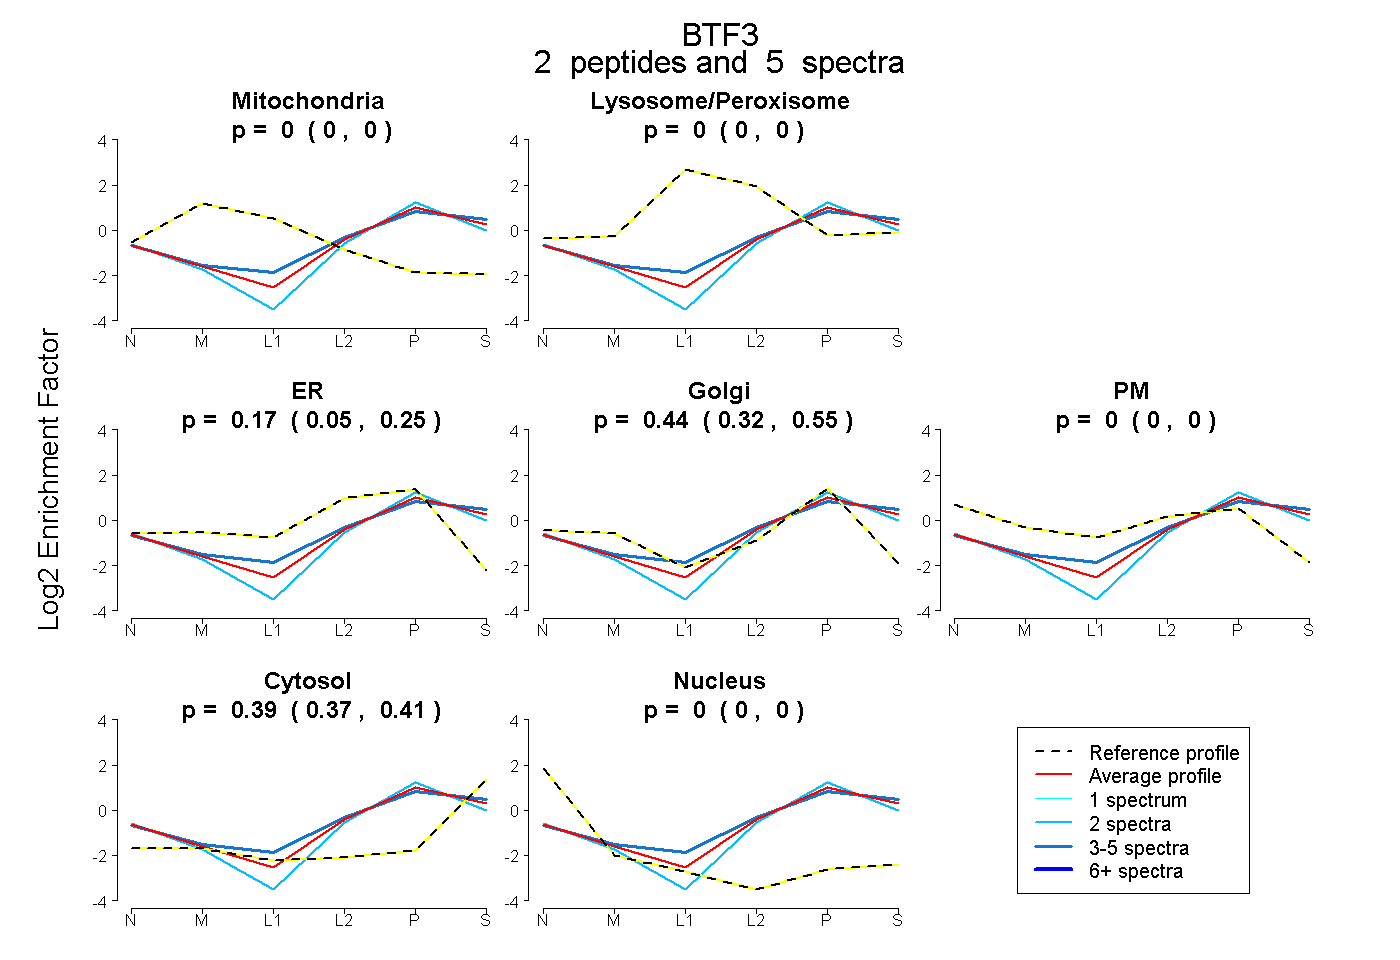 |
0.000 0.000 | 0.000 |
0.000 0.000 | 0.000 |
0.166 0.050 | 0.253 |
0.439 0.323 | 0.546 |
0.000 0.000 | 0.000 |
0.394 0.371 | 0.412 |
0.000 0.000 | 0.000 |
|||
| Plot | Lyso | Other | |||||||||||
| Expt C |
3 peptides |
17 spectra |
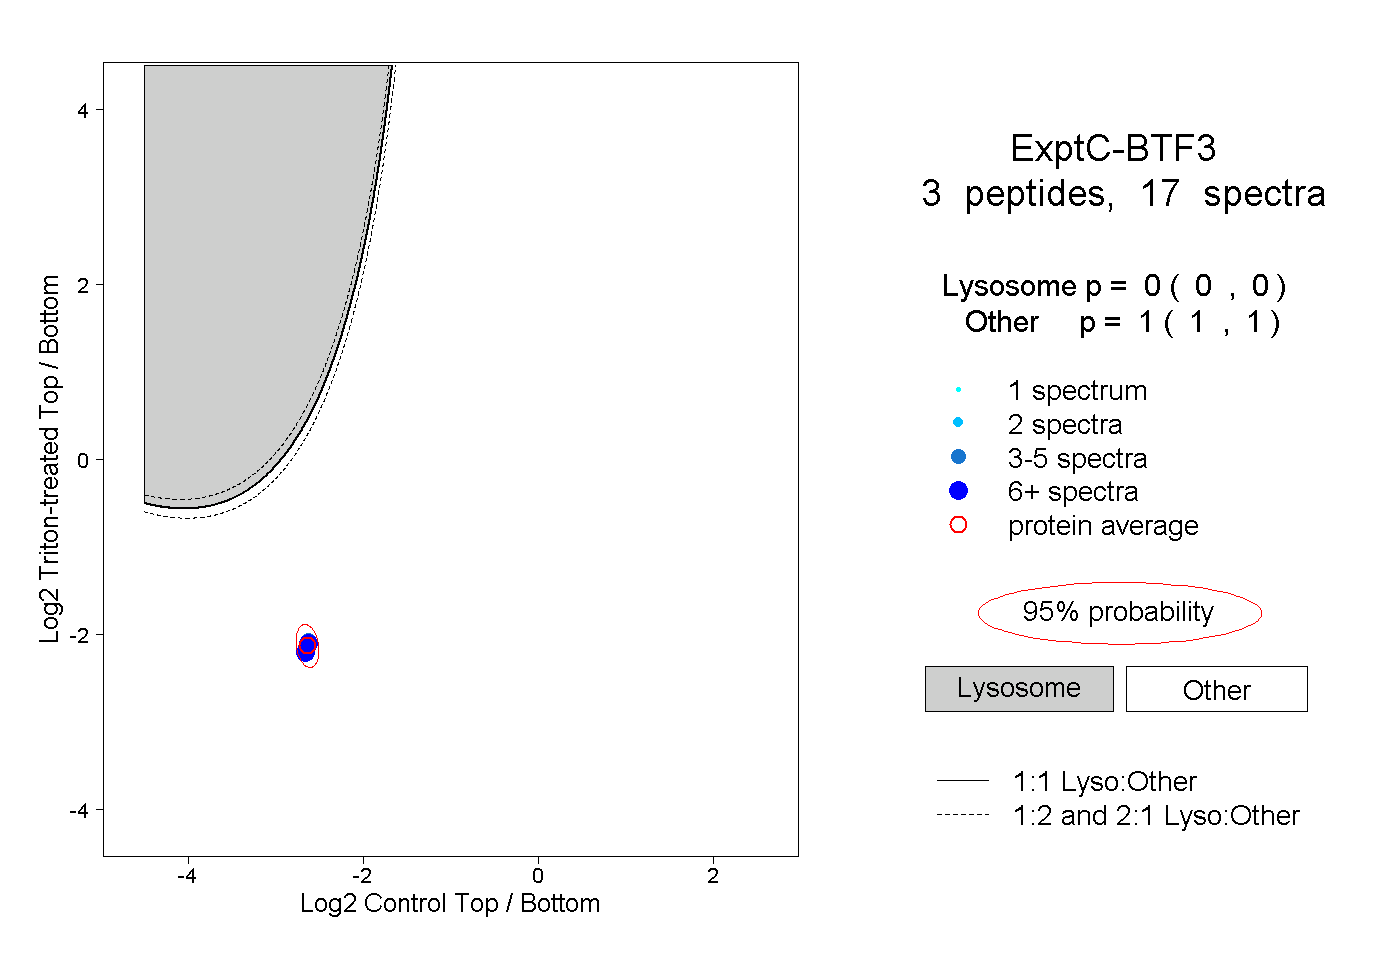 |
0.000 0.000 | 0.000 |
1.000 1.000 | 1.000 |