14
14peptides
spectra
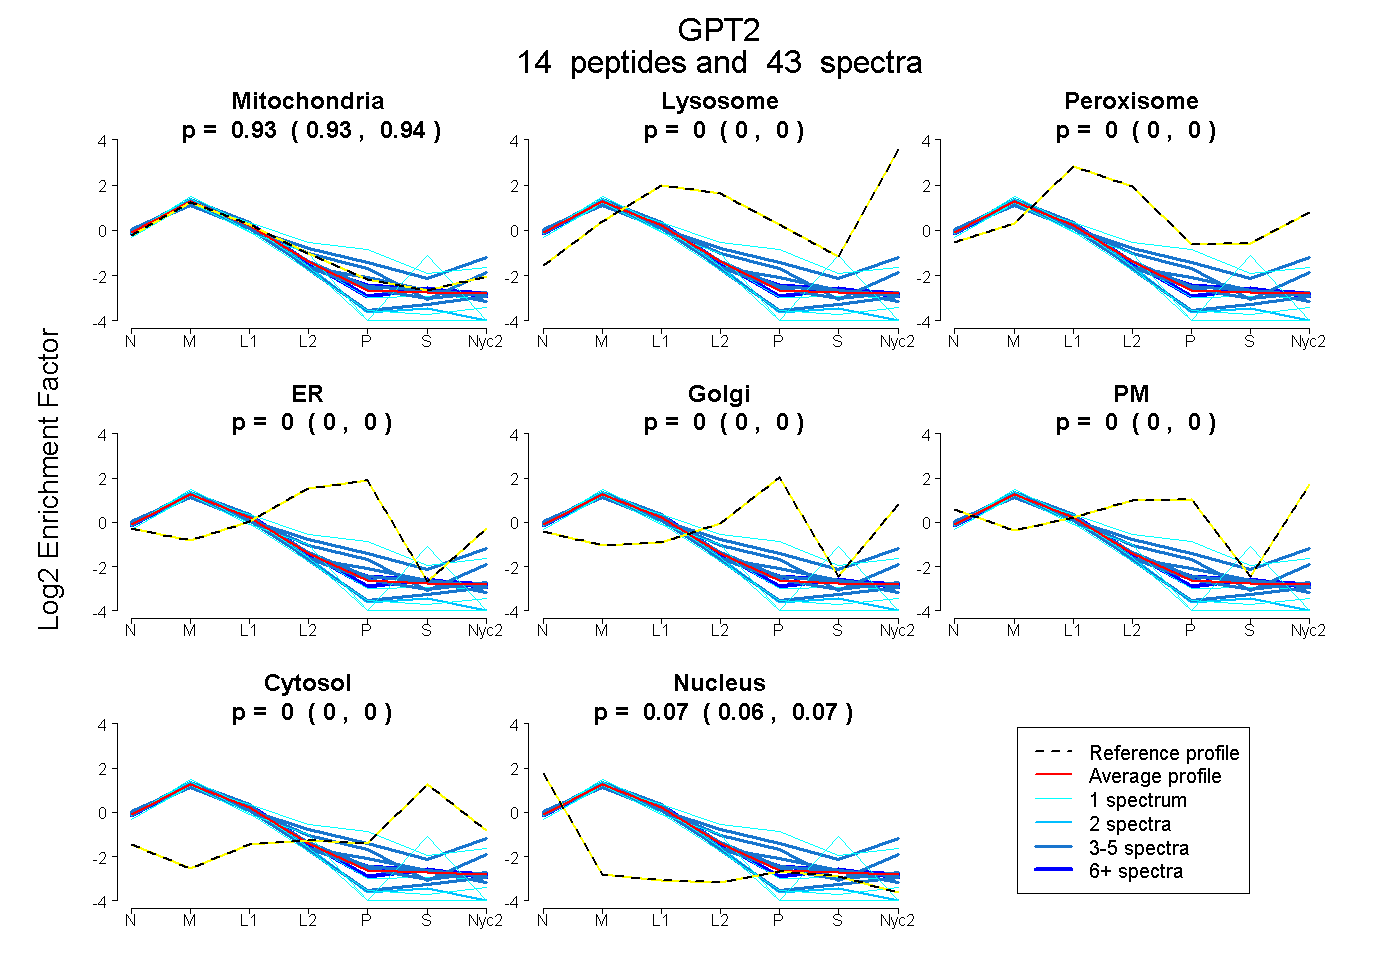
0.930 | 0.936
0.000 | 0.000
0.000 | 0.000
0.000 | 0.000
0.000 | 0.000
0.000 | 0.000
0.000 | 0.000
0.063 | 0.069
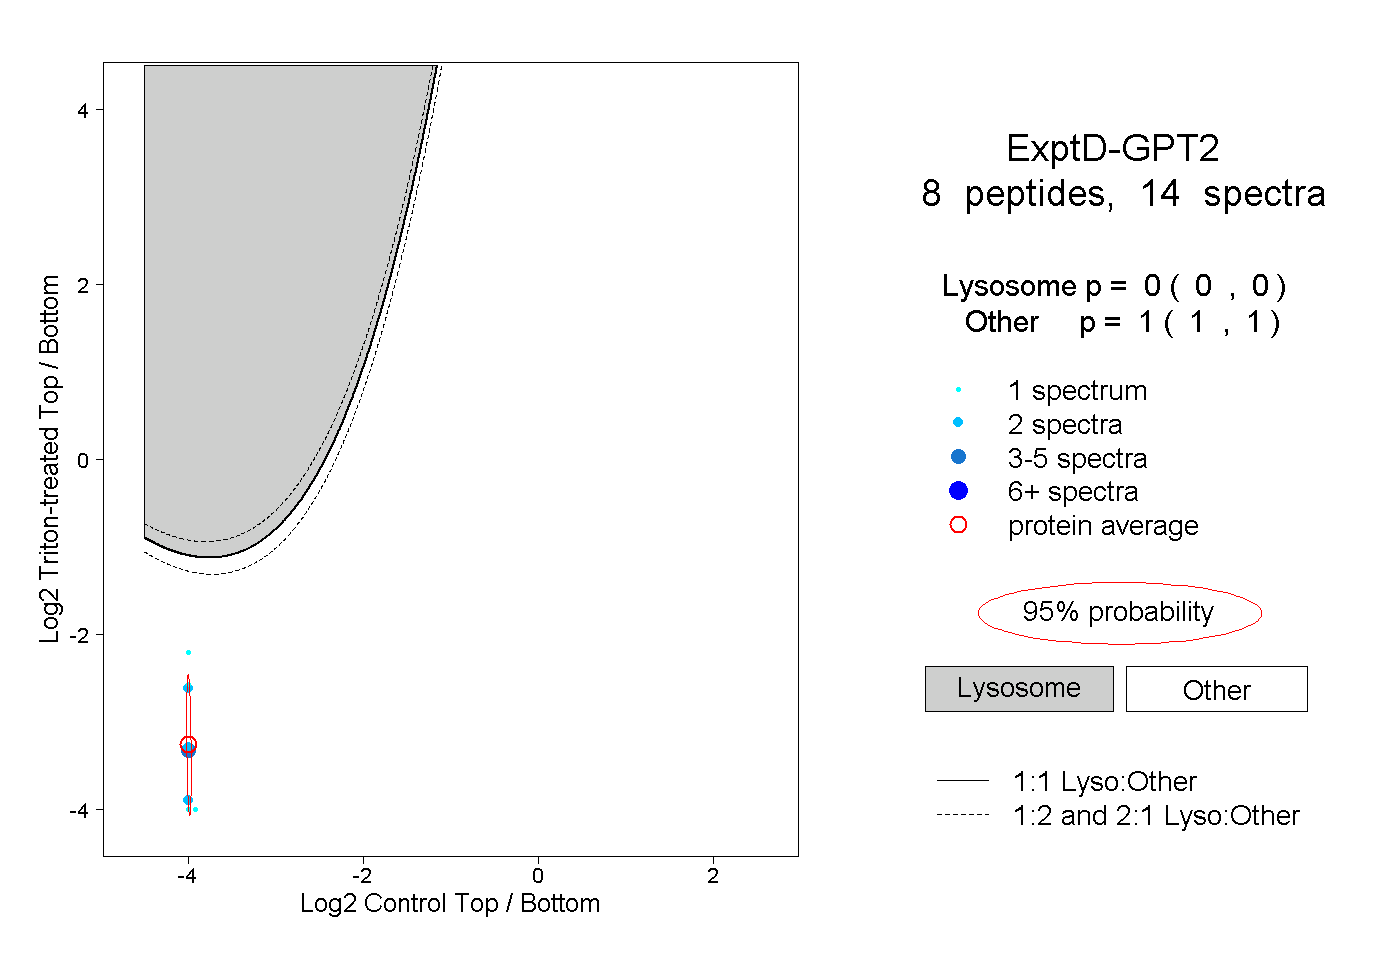
8peptides
spectra
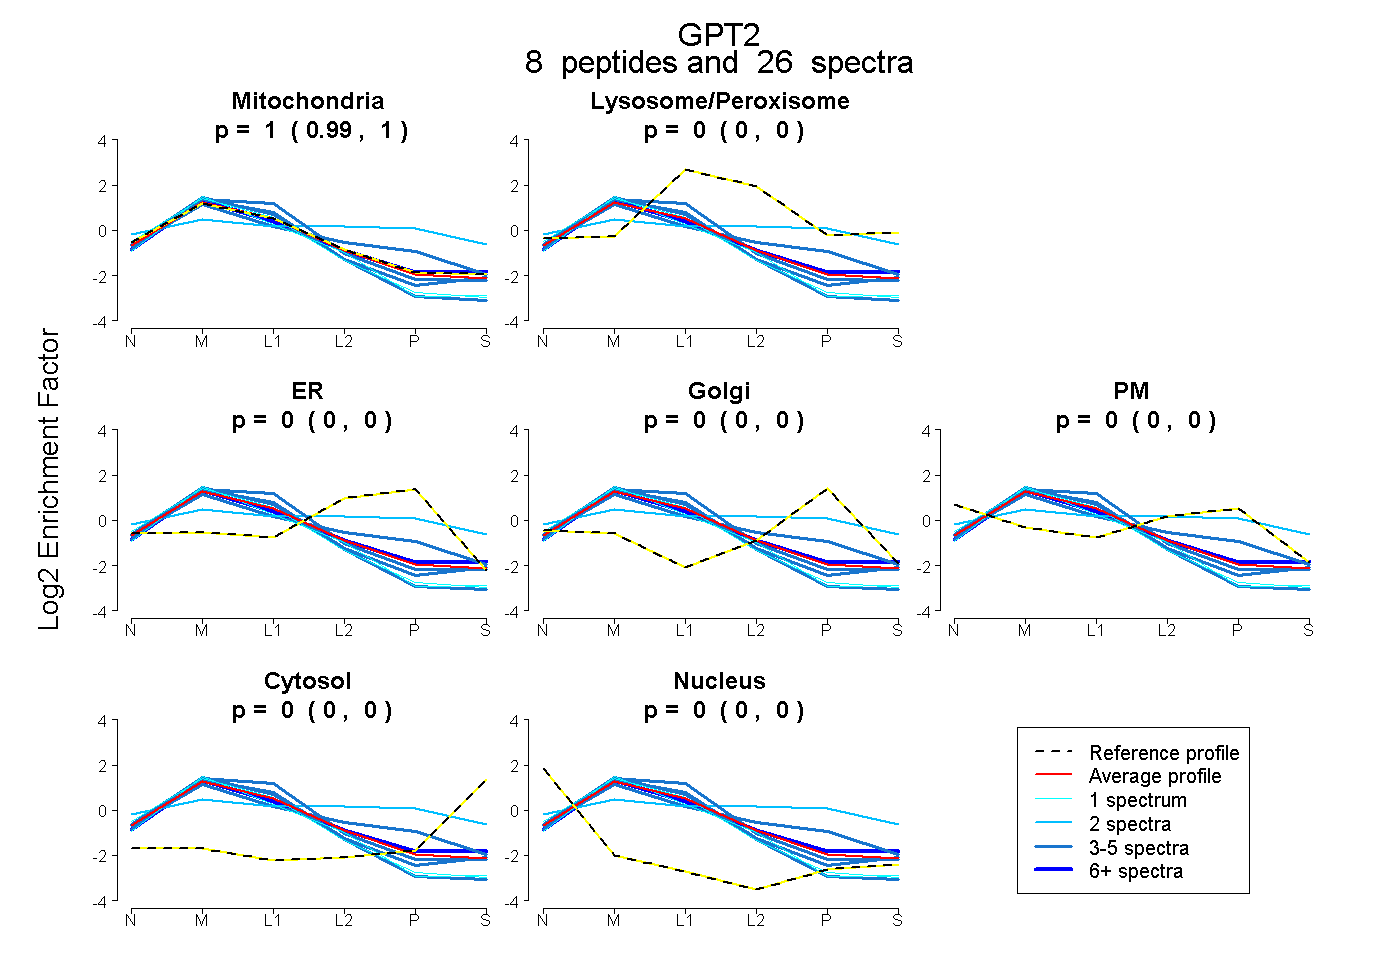
0.993 | 1.000
0.000 | 0.000
0.000 | 0.000
0.000 | 0.001
0.000 | 0.000
0.000 | 0.000
0.000 | 0.001