IKBKAP
[ENSRNOP00000022836]
Main page
| | | Plot |
Mito |
Lyso |
|
Perox |
ER |
Golgi |
PM |
Cytosol |
Nucleus |
|
| Expt A |
 11
11
peptides |
29
spectra |
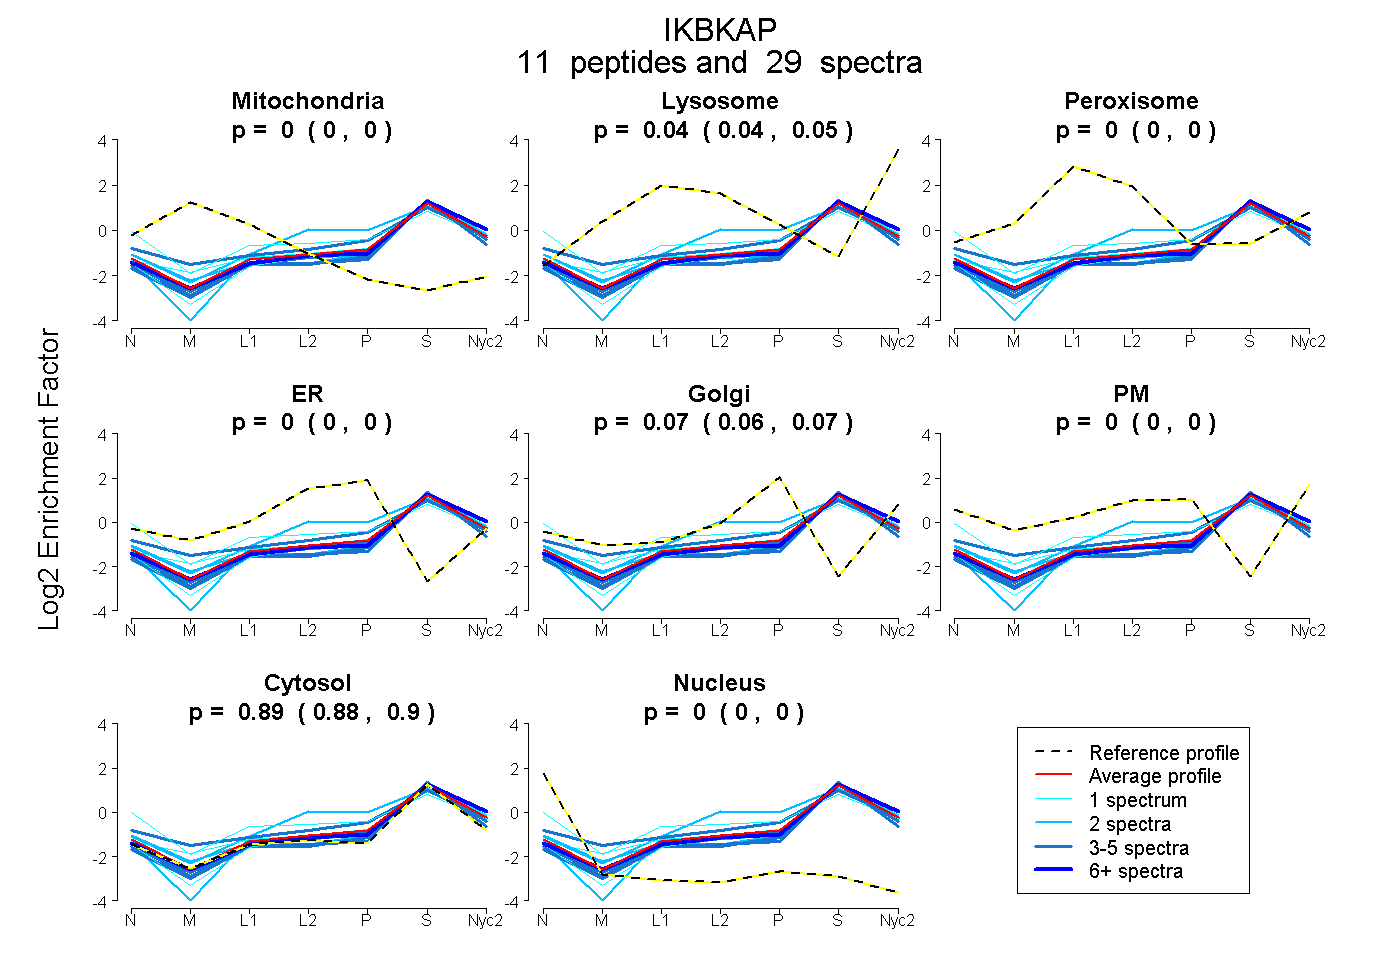 |
0.000
0.000 | 0.000 |
0.044
0.036 | 0.050 |
|
0.000
0.000 | 0.000 |
0.000
0.000 | 0.000 |
0.065
0.056 | 0.072 |
0.000
0.000 | 0.000 |
0.891
0.885 | 0.897 |
0.000
0.000 | 0.000 |
|
| | | Plot |
Mito |
|
Lyso or Perox |
|
ER |
Golgi |
PM |
Cytosol |
Nucleus |
|
| Expt B |
3
peptides |
4
spectra |
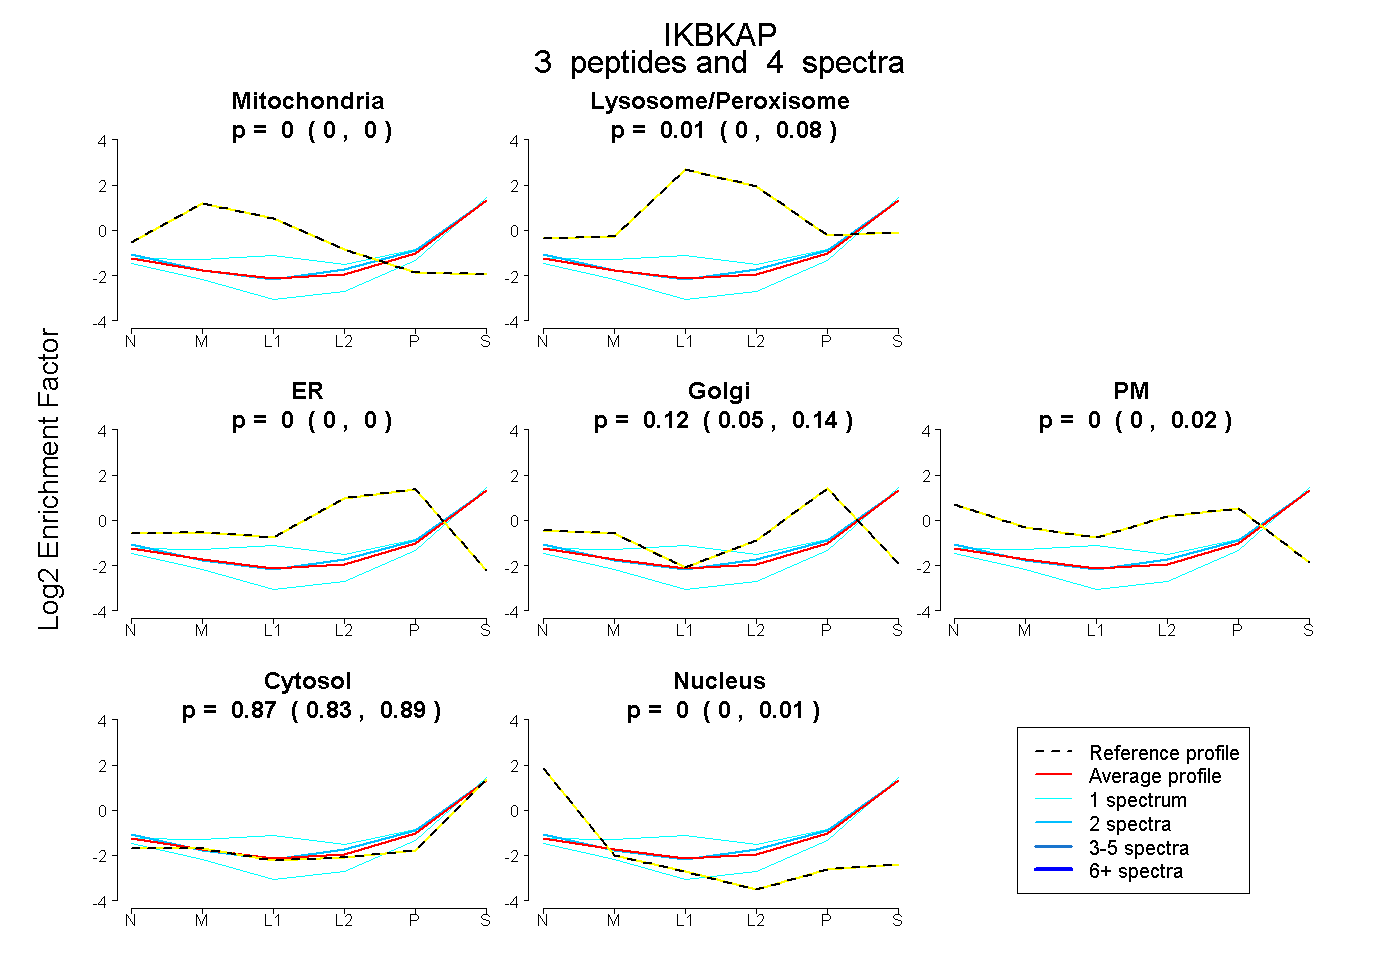 |
0.000
0.000 | 0.000 |
|
0.011
0.000 | 0.080 |
|
0.000
0.000 | 0.000 |
0.117
0.054 | 0.140 |
0.000
0.000 | 0.019 |
0.871
0.827 | 0.894 |
0.000
0.000 | 0.013 |
|
| | | Plot |
|
Lyso |
|
|
|
|
|
|
|
Other |
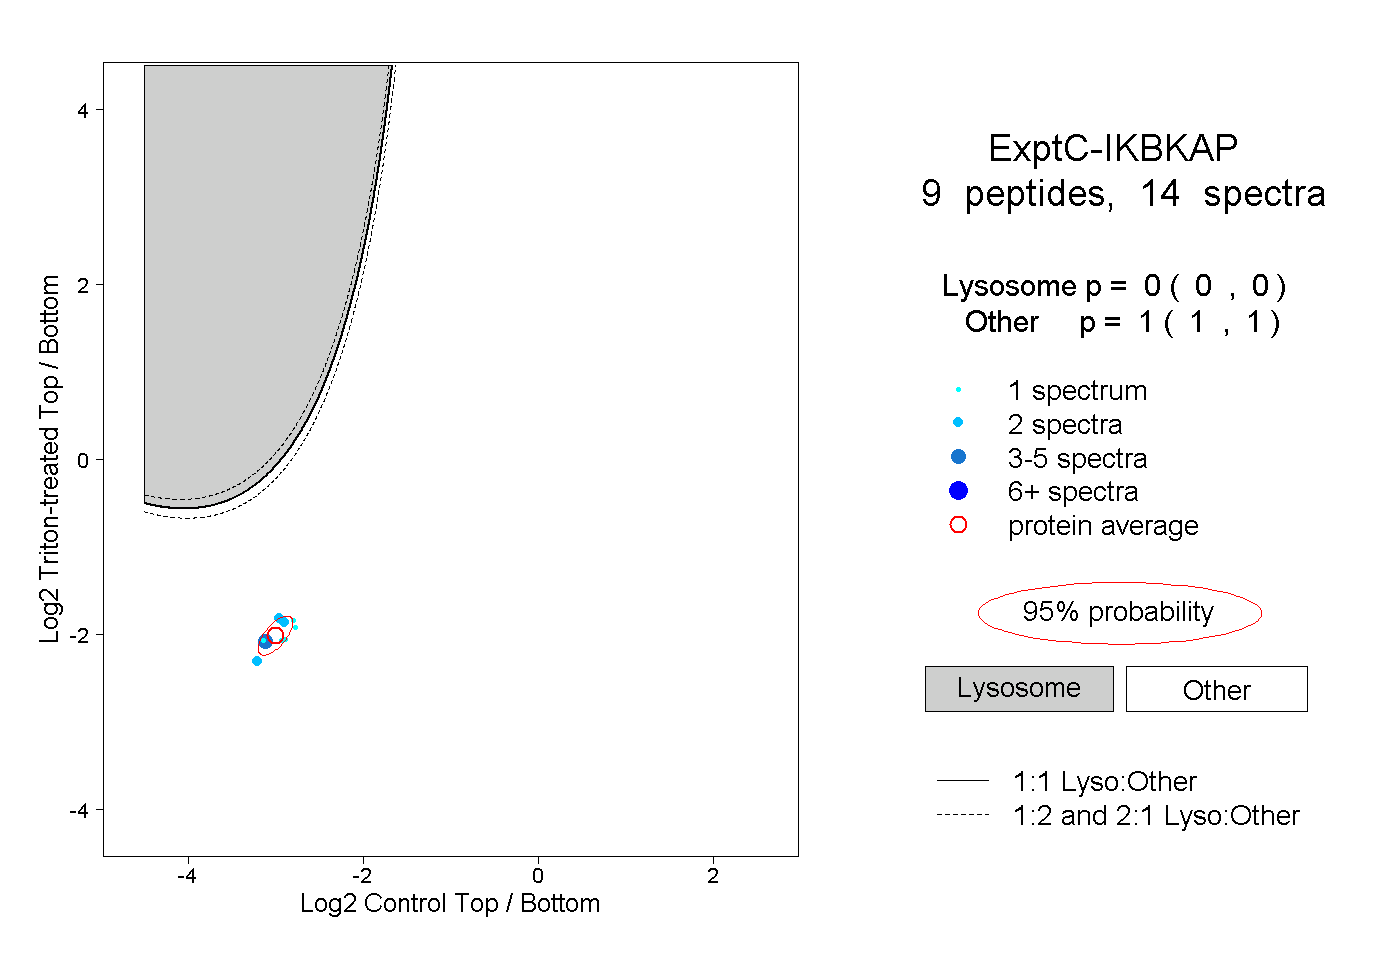
| Expt C |
9
peptides |
14
spectra |
 |
|
0.000
0.000 | 0.000 |
|
|
|
|
|
|
|
1.000
1.000 | 1.000 |
| 1 spectrum, VLVTVFQR |
|
0.000 |
|
|
|
|
|
|
|
1.000 |
| 1 spectrum, SVQVSTNPDGK |
|
0.000 |
|
|
|
|
|
|
|
1.000 |
| 3 spectra, ALVLAQIR |
|
0.000 |
|
|
|
|
|
|
|
1.000 |
| 1 spectrum, IVTVVPQDTK |
|
0.000 |
|
|
|
|
|
|
|
1.000 |
| 2 spectra, AEQGTVLIGSER |
|
0.000 |
|
|
|
|
|
|
|
1.000 |
| 1 spectrum, TPHLEK |
|
0.000 |
|
|
|
|
|
|
|
1.000 |
| 1 spectrum, LILQMPR |
|
0.000 |
|
|
|
|
|
|
|
1.000 |
| 2 spectra, EGSSTLK |
|
0.000 |
|
|
|
|
|
|
|
1.000 |
| 2 spectra, LGAVGGTGFK |
|
0.000 |
|
|
|
|
|
|
|
1.000 |
| | | Plot |
|
Lyso |
|
|
|
|
|
|
|
Other |
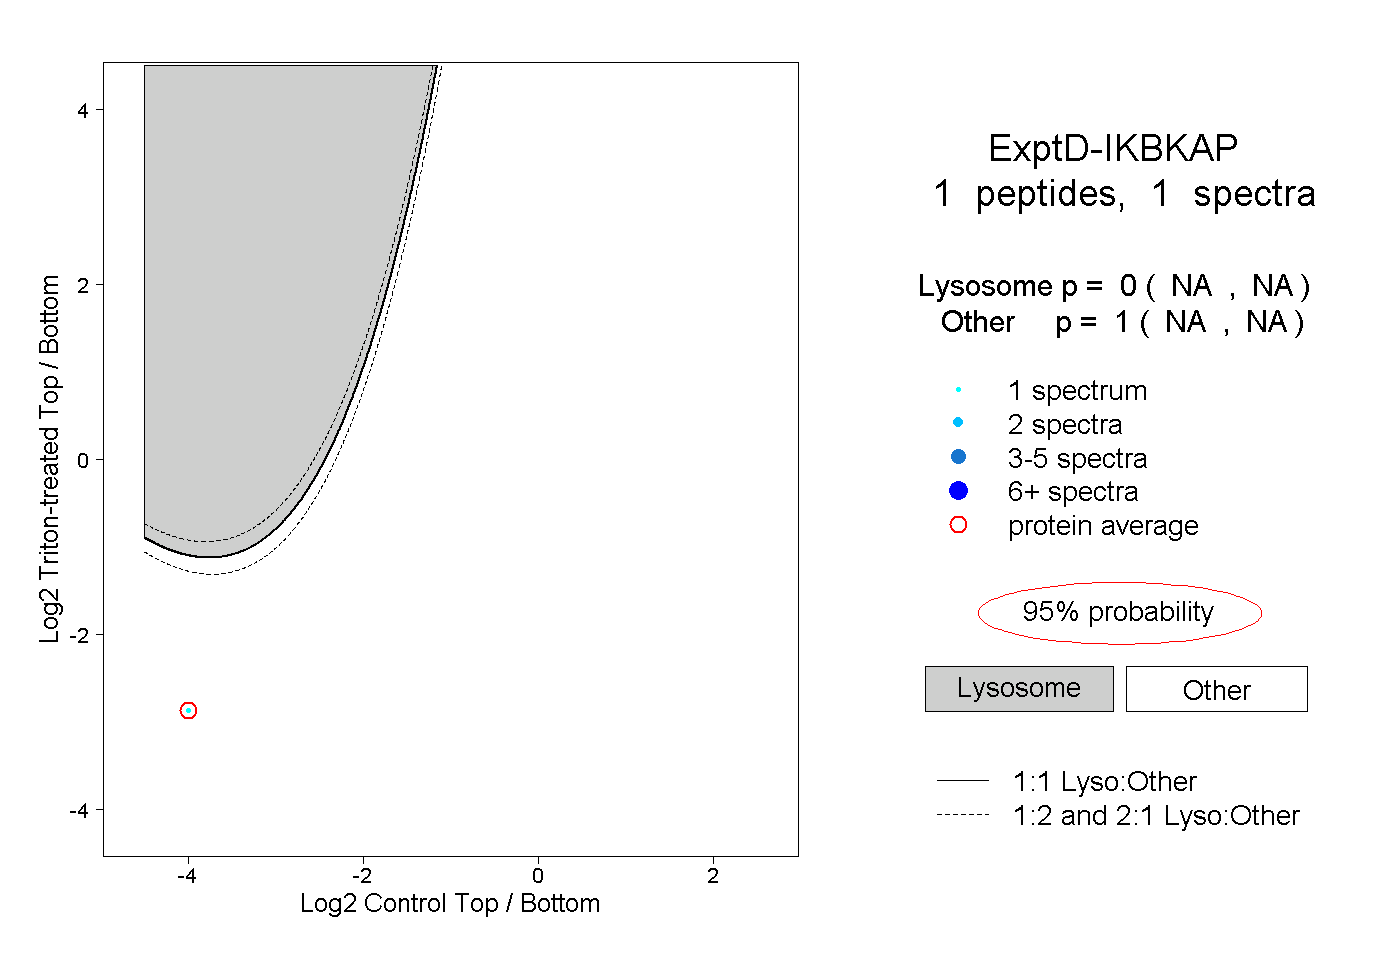
| Expt D |
1
peptide |
1
spectrum |
 |
|
0.000
NA | NA |
|
|
|
|
|
|
|
1.000
NA | NA |