11
11peptides
spectra
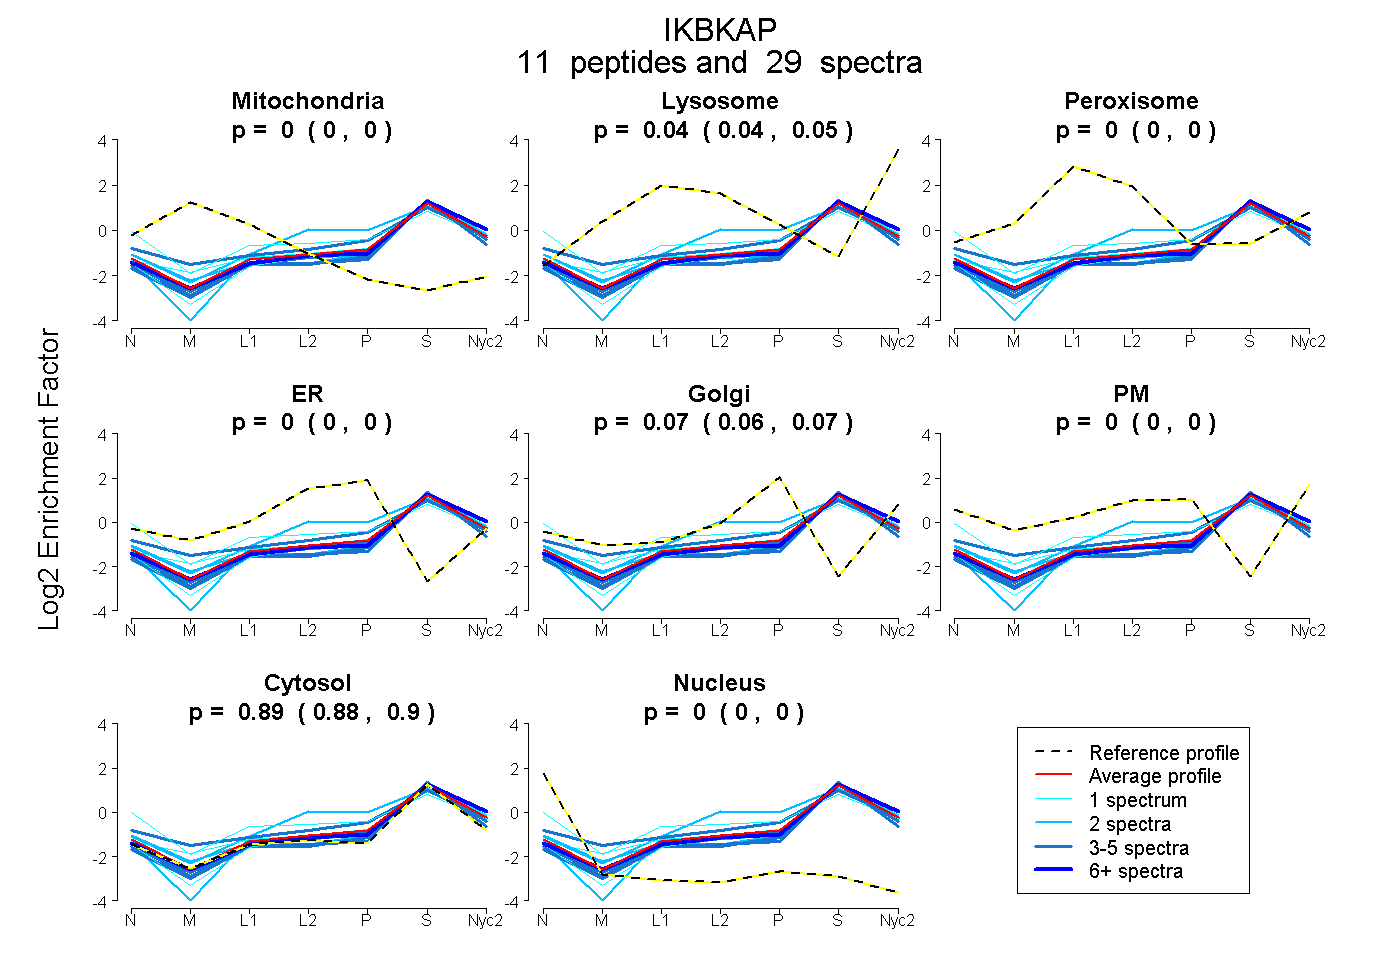
0.000 | 0.000
0.036 | 0.050
0.000 | 0.000
0.000 | 0.000
0.056 | 0.072
0.000 | 0.000
0.885 | 0.897
0.000 | 0.000
3peptides
spectra
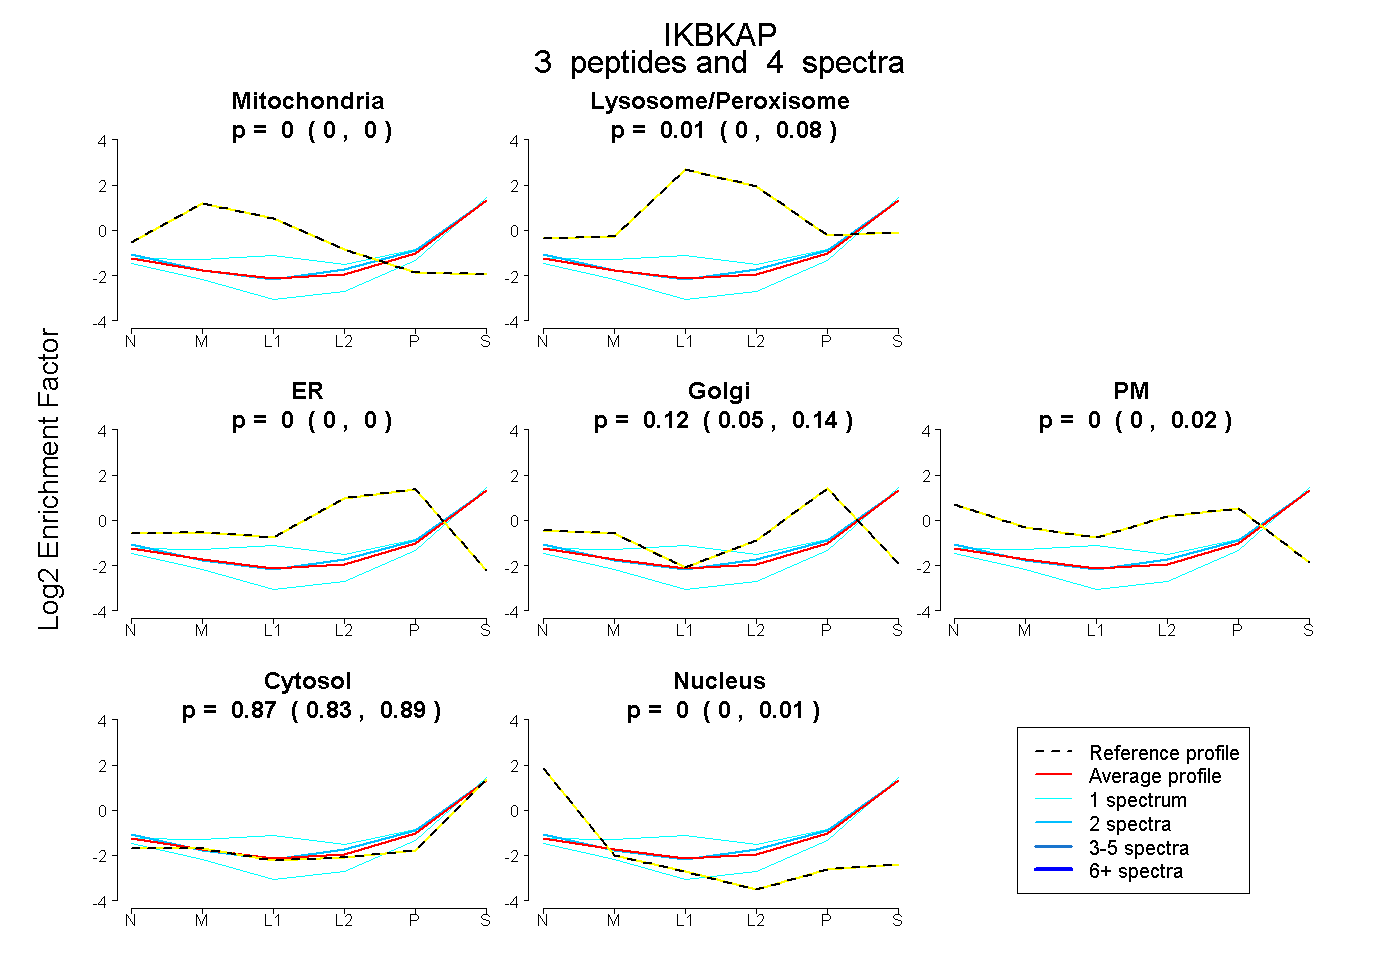
0.000 | 0.000
0.000 | 0.080
0.000 | 0.000
0.054 | 0.140
0.000 | 0.019
0.827 | 0.894
0.000 | 0.013