 11
11peptides
spectra
0.000 | 0.000
0.036 | 0.050
0.000 | 0.000
0.000 | 0.000
0.056 | 0.072
0.000 | 0.000
0.885 | 0.897
0.000 | 0.000
| Plot | Mito | Lyso | Perox | ER | Golgi | PM | Cytosol | Nucleus | |||||
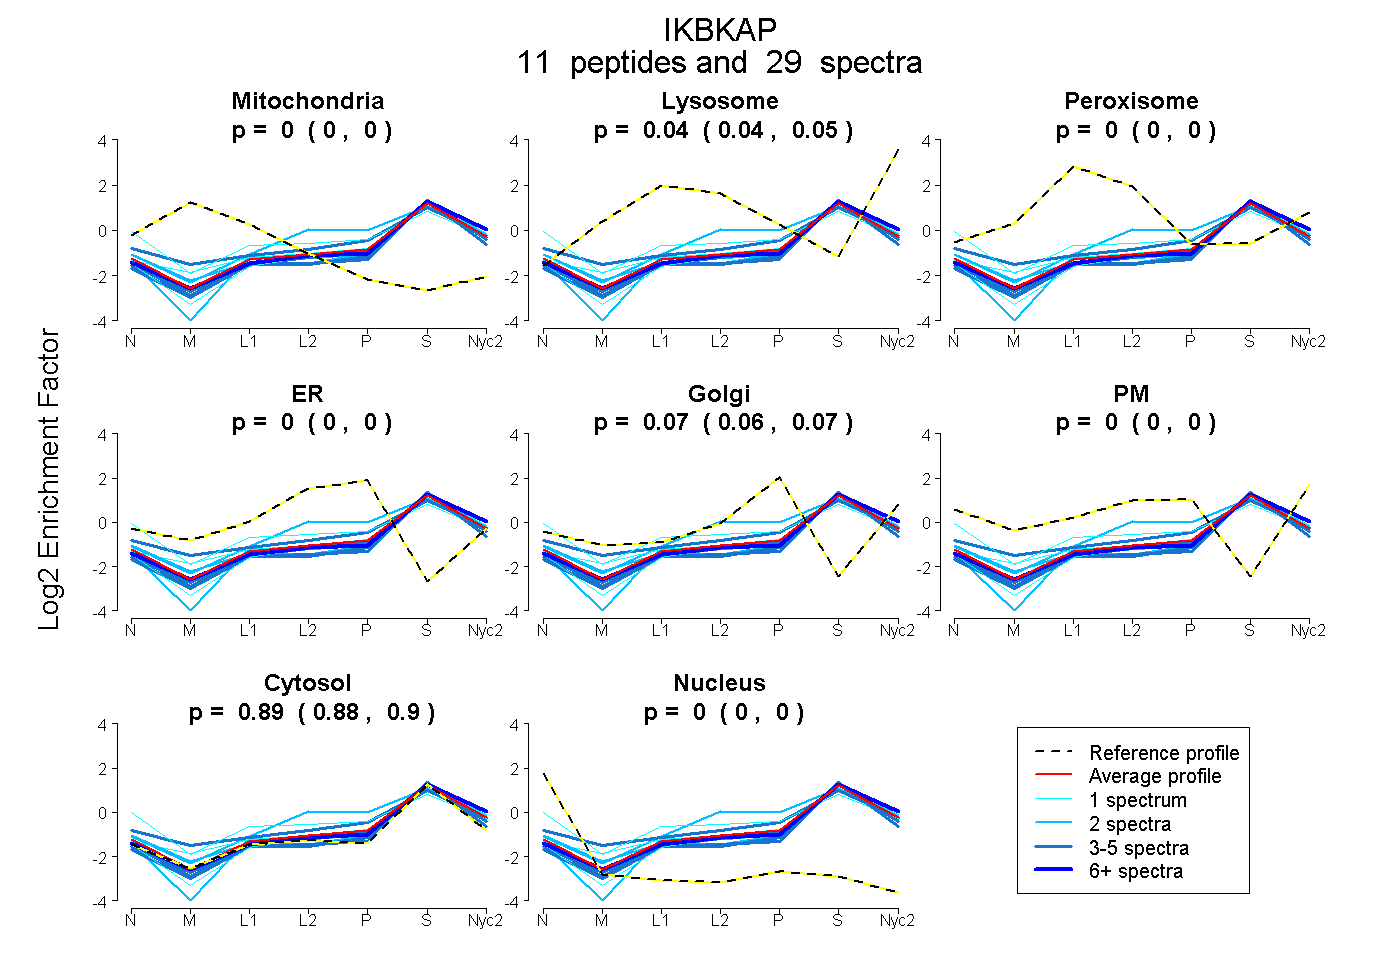
| Expt A |
11 peptides |
29 spectra |
|
0.000 0.000 | 0.000 |
0.044 0.036 | 0.050 |
0.000 0.000 | 0.000 |
0.000 0.000 | 0.000 |
0.065 0.056 | 0.072 |
0.000 0.000 | 0.000 |
0.891 0.885 | 0.897 |
0.000 0.000 | 0.000 |
| 1 spectrum, VLFLFEFEEQAR | 0.000 | 0.003 | 0.000 | 0.000 | 0.029 | 0.000 | 0.968 | 0.000 | ||
| 2 spectra, ETDLFSETSSIR | 0.000 | 0.000 | 0.000 | 0.000 | 0.000 | 0.000 | 1.000 | 0.000 | ||
| 6 spectra, VLVTVFQR | 0.000 | 0.075 | 0.000 | 0.000 | 0.011 | 0.000 | 0.914 | 0.000 | ||
| 2 spectra, ALVLAQIR | 0.000 | 0.063 | 0.000 | 0.207 | 0.000 | 0.000 | 0.731 | 0.000 | ||
| 1 spectrum, SGSEMSGR | 0.000 | 0.000 | 0.062 | 0.000 | 0.000 | 0.241 | 0.691 | 0.006 | ||
| 1 spectrum, IVTVVPQDTK | 0.000 | 0.132 | 0.000 | 0.000 | 0.034 | 0.000 | 0.833 | 0.000 | ||
| 3 spectra, INLNLIHDHNPK | 0.000 | 0.025 | 0.034 | 0.000 | 0.059 | 0.125 | 0.757 | 0.000 | ||
| 3 spectra, VFLENVETFIK | 0.000 | 0.000 | 0.000 | 0.000 | 0.000 | 0.000 | 1.000 | 0.000 | ||
| 4 spectra, TVTPPPMCTYR | 0.000 | 0.000 | 0.000 | 0.000 | 0.000 | 0.000 | 1.000 | 0.000 | ||
| 4 spectra, LILQMPR | 0.000 | 0.023 | 0.000 | 0.000 | 0.045 | 0.000 | 0.932 | 0.000 | ||
| 2 spectra, SSAVQLADGQVLK | 0.000 | 0.029 | 0.000 | 0.000 | 0.023 | 0.044 | 0.904 | 0.000 |
| Plot | Mito | Lyso or Perox | ER | Golgi | PM | Cytosol | Nucleus | ||||||
| Expt B |
3 peptides |
4 spectra |
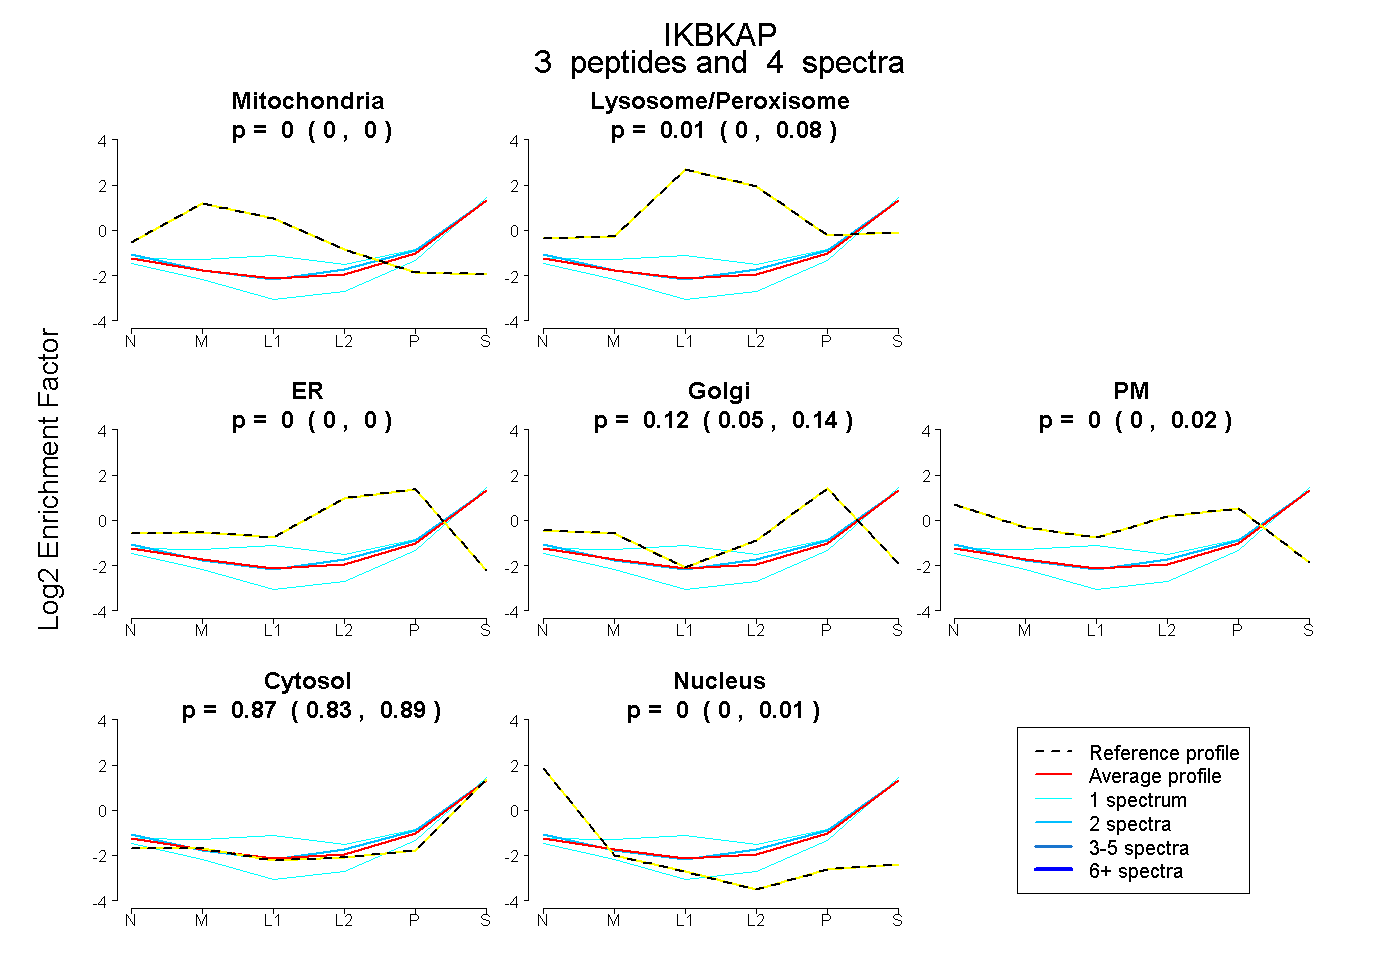 |
0.000 0.000 | 0.000 |
0.011 0.000 | 0.080 |
0.000 0.000 | 0.000 |
0.117 0.054 | 0.140 |
0.000 0.000 | 0.019 |
0.871 0.827 | 0.894 |
0.000 0.000 | 0.013 |
|||
| Plot | Lyso | Other | |||||||||||
| Expt C |
9 peptides |
14 spectra |
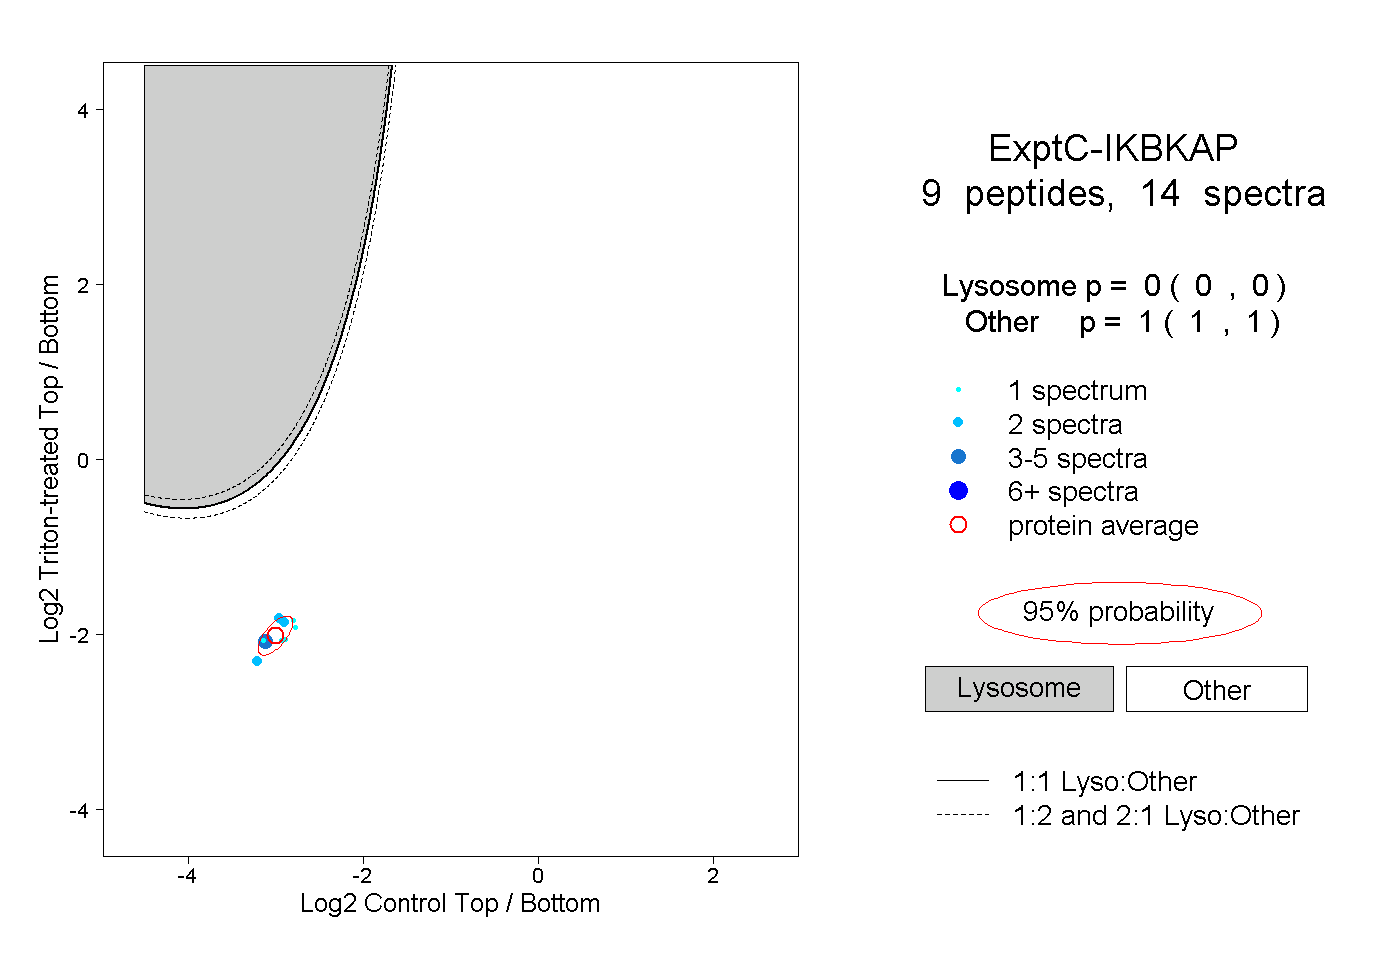 |
0.000 0.000 | 0.000 |
1.000 1.000 | 1.000 |
||||||||
| Plot | Lyso | Other | |||||||||||
| Expt D |
1 peptide |
1 spectrum |
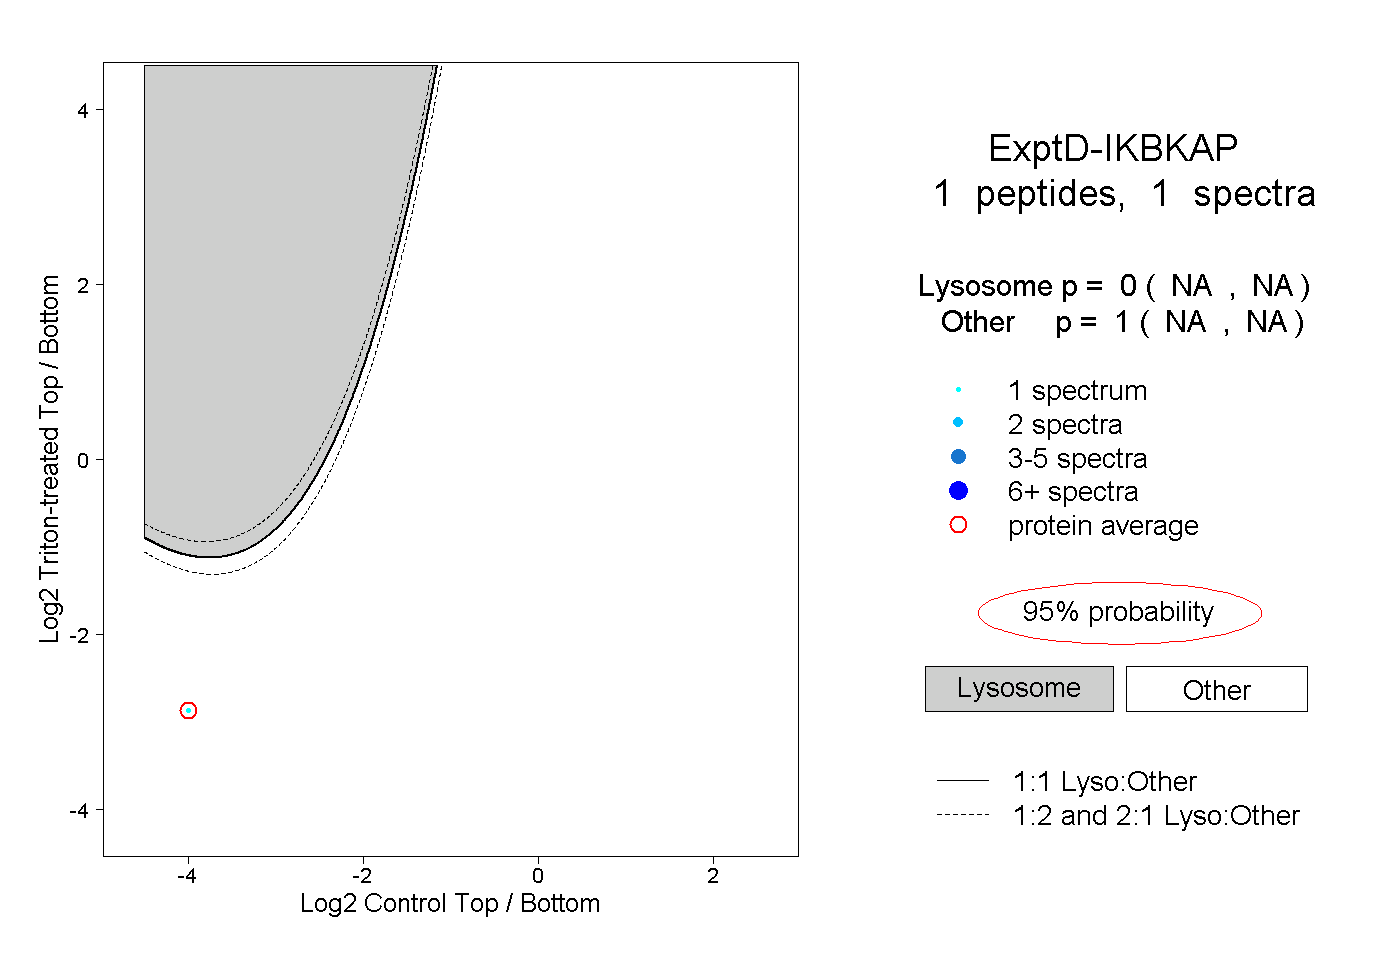 |
0.000 NA | NA |
1.000 NA | NA |