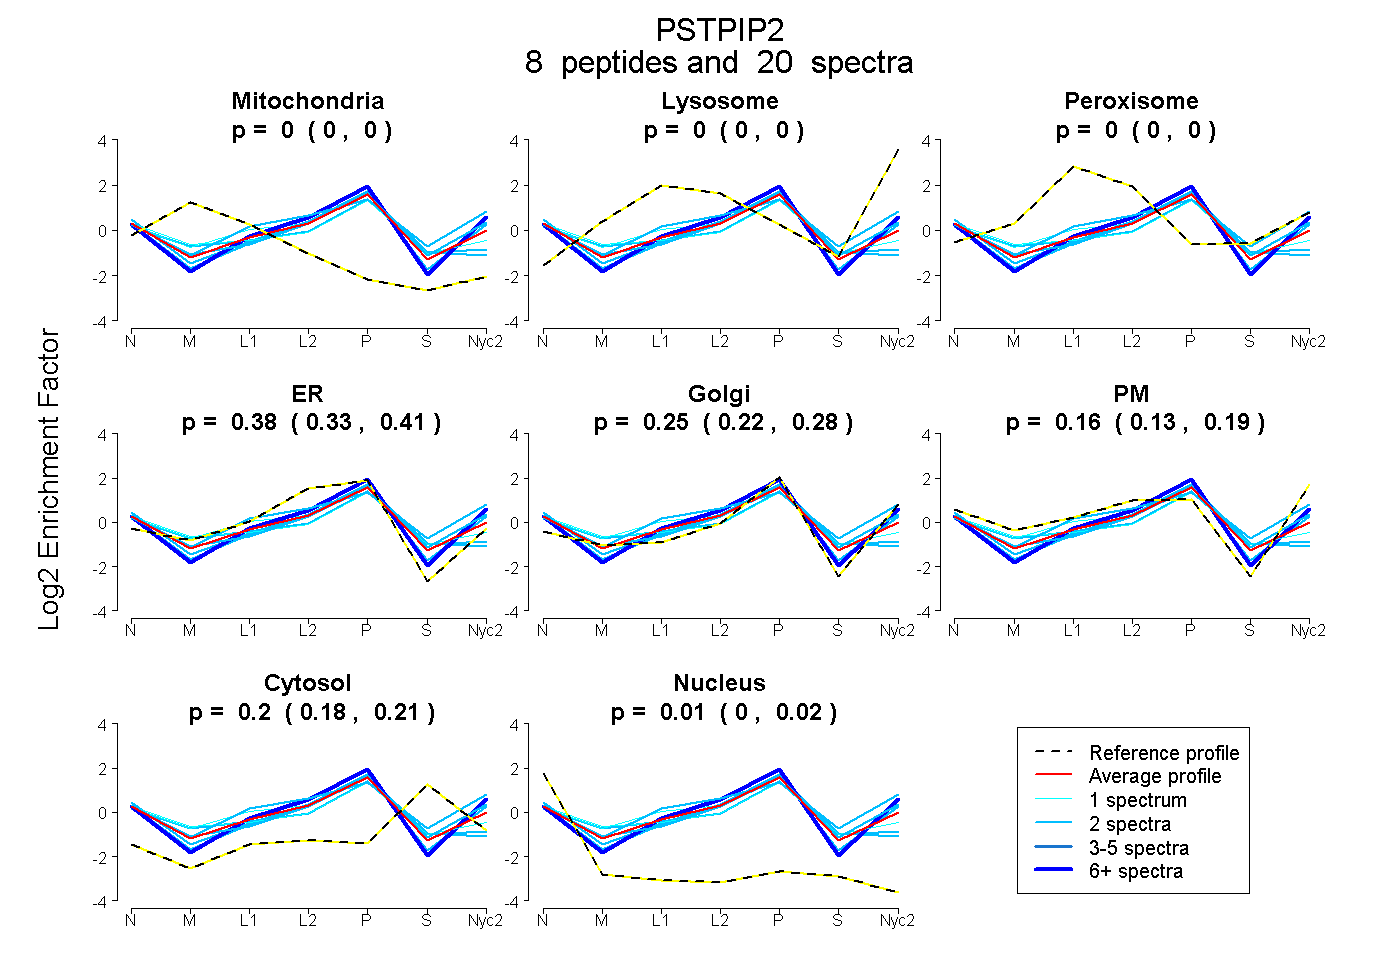
 8
8peptides
spectra
0.000 | 0.000
0.000 | 0.000
0.000 | 0.000
0.333 | 0.413
0.225 | 0.279
0.130 | 0.189
0.184 | 0.209
0.000 | 0.017
| Plot | Mito | Lyso | Perox | ER | Golgi | PM | Cytosol | Nucleus | |||||
| Expt A |
8 peptides |
20 spectra |
|
0.000 0.000 | 0.000 |
0.000 0.000 | 0.000 |
0.000 0.000 | 0.000 |
0.379 0.333 | 0.413 |
0.253 0.225 | 0.279 |
0.161 0.130 | 0.189 |
0.198 0.184 | 0.209 |
0.009 0.000 | 0.017 |
| 2 spectra, ACEVFEAQECER | 0.064 | 0.000 | 0.000 | 0.492 | 0.174 | 0.000 | 0.239 | 0.030 | ||
| 1 spectrum, ALDVFK | 0.000 | 0.000 | 0.189 | 0.145 | 0.583 | 0.041 | 0.000 | 0.043 | ||
| 8 spectra, SANMANQR | 0.000 | 0.000 | 0.000 | 0.296 | 0.472 | 0.152 | 0.080 | 0.000 | ||
| 2 spectra, TAVEDSDK | 0.000 | 0.000 | 0.000 | 0.202 | 0.373 | 0.222 | 0.202 | 0.000 | ||
| 2 spectra, EFEEFLK | 0.000 | 0.000 | 0.000 | 0.291 | 0.383 | 0.184 | 0.100 | 0.042 | ||
| 1 spectrum, SLETCSIEK | 0.034 | 0.000 | 0.093 | 0.269 | 0.379 | 0.000 | 0.175 | 0.051 | ||
| 2 spectra, QQVDNVAQCHIQLAQTLR | 0.000 | 0.000 | 0.000 | 0.667 | 0.002 | 0.000 | 0.259 | 0.072 | ||
| 2 spectra, TAGPHPAR | 0.000 | 0.000 | 0.145 | 0.073 | 0.225 | 0.372 | 0.186 | 0.000 |
| Plot | Mito | Lyso or Perox | ER | Golgi | PM | Cytosol | Nucleus | ||||||
| Expt B |
1 peptide |
1 spectrum |
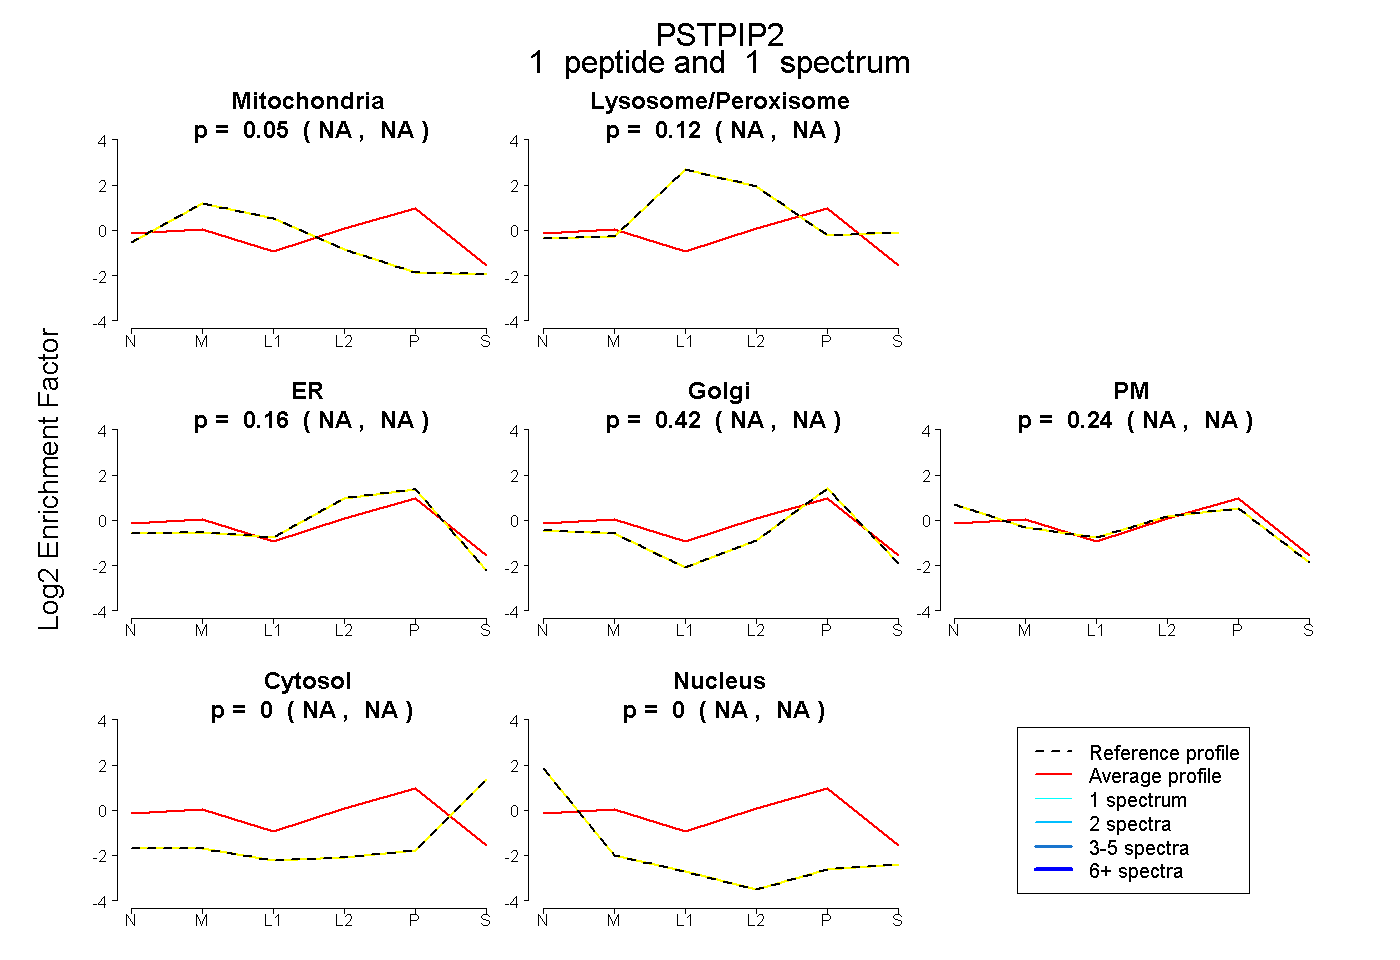 |
0.053 NA | NA |
0.120 NA | NA |
0.158 NA | NA |
0.424 NA | NA |
0.245 NA | NA |
0.000 NA | NA |
0.000 NA | NA |
|||
| Plot | Lyso | Other | |||||||||||
| Expt C |
6 peptides |
12 spectra |
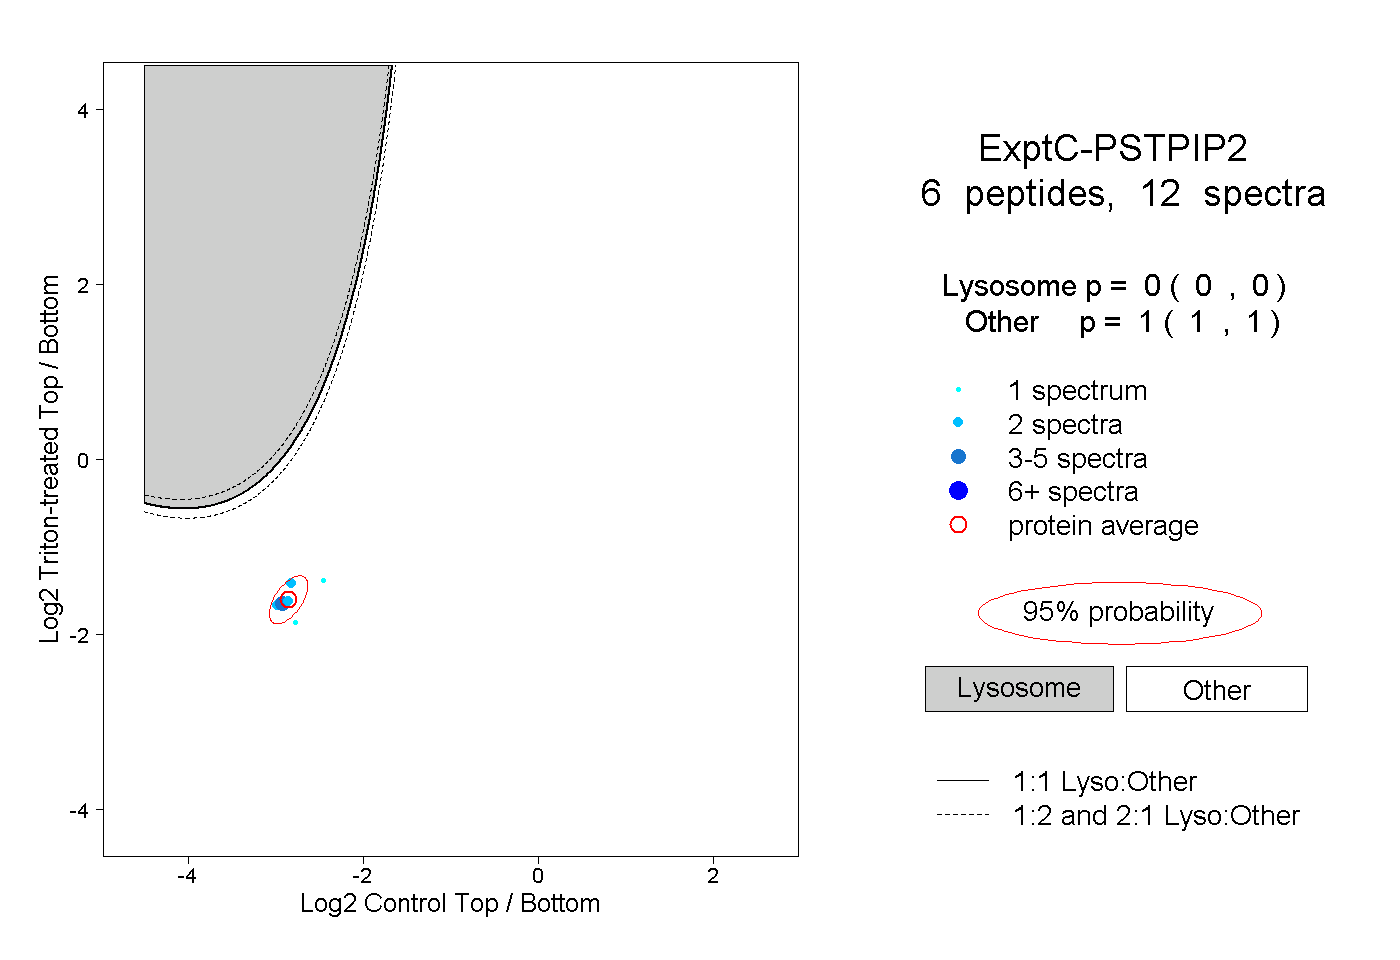 |
0.000 0.000 | 0.000 |
1.000 1.000 | 1.000 |
||||||||
| Plot | Lyso | Other | |||||||||||
| Expt D |
3 peptides |
3 spectra |
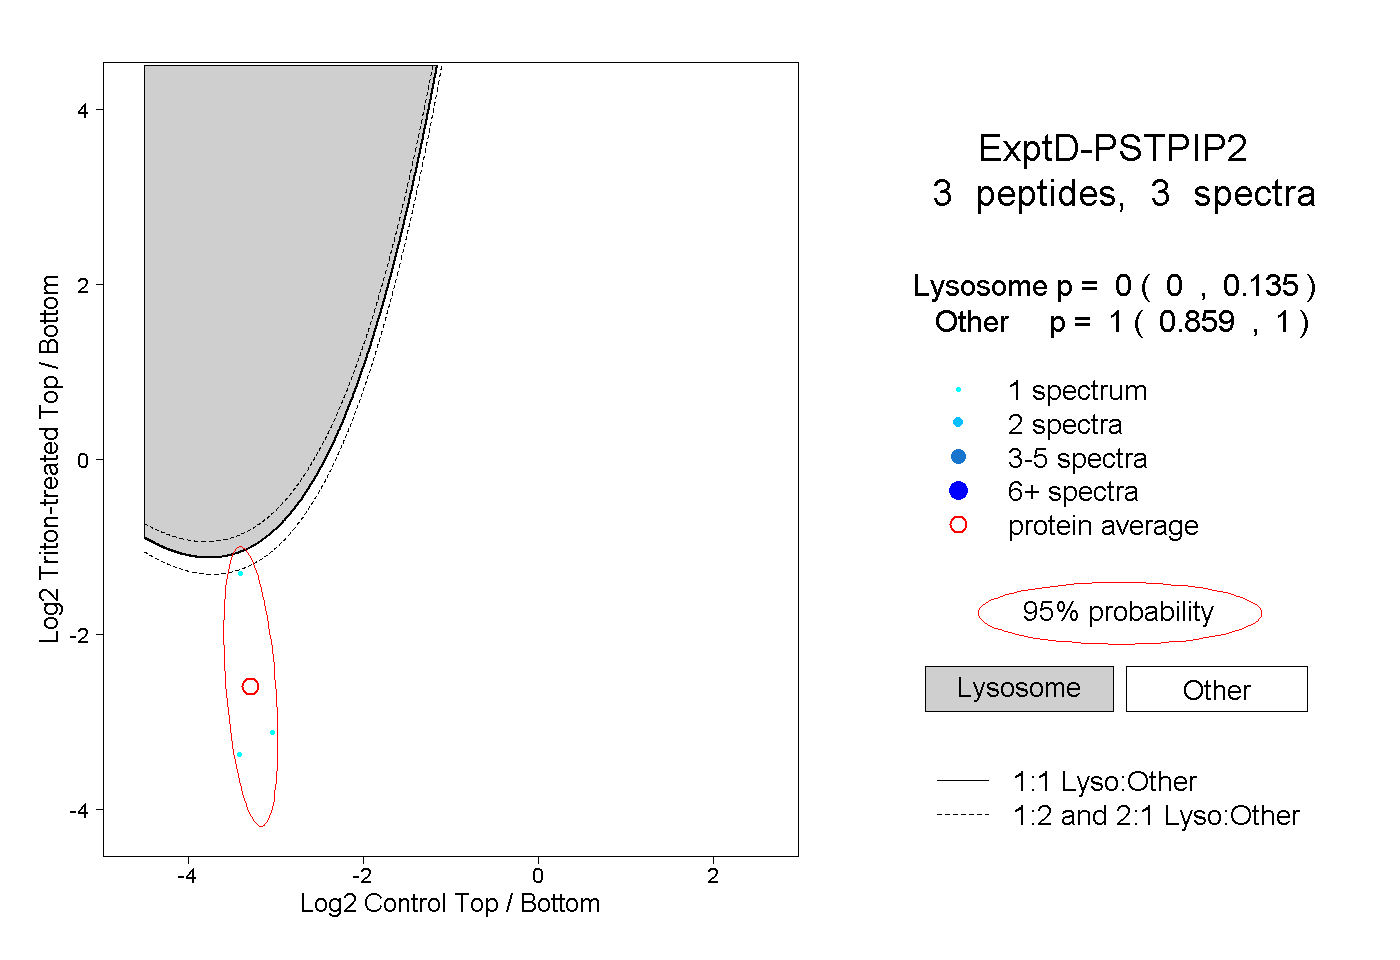 |
0.000 0.000 | 0.135 |
1.000 0.859 | 1.000 |