13
13peptides
spectra
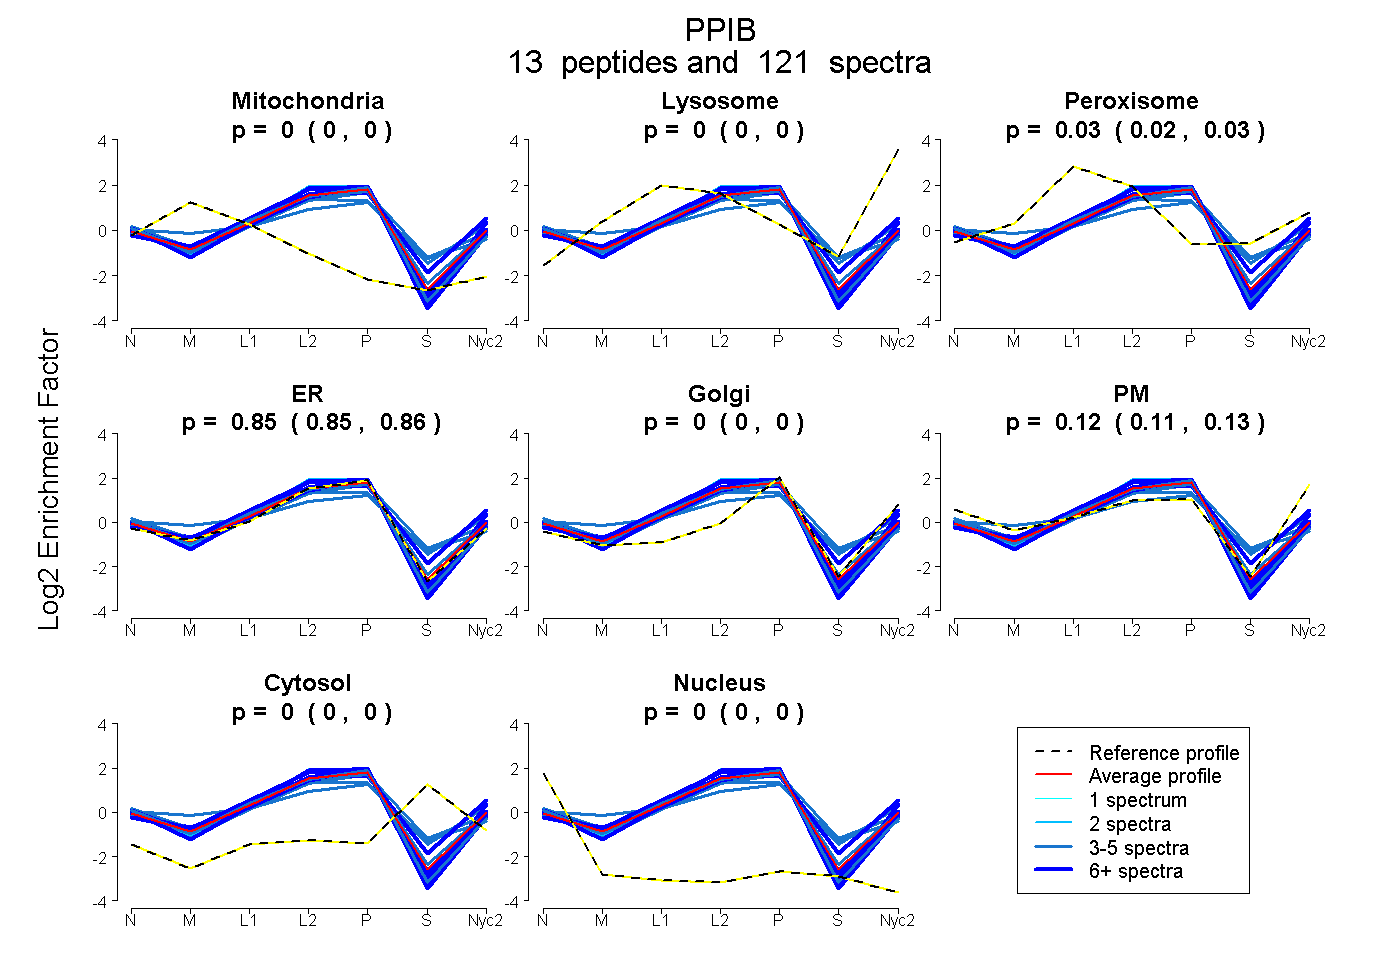
0.000 | 0.000
0.000 | 0.000
0.023 | 0.031
0.847 | 0.856
0.000 | 0.000
0.115 | 0.125
0.000 | 0.000
0.000 | 0.000
13peptides
spectra
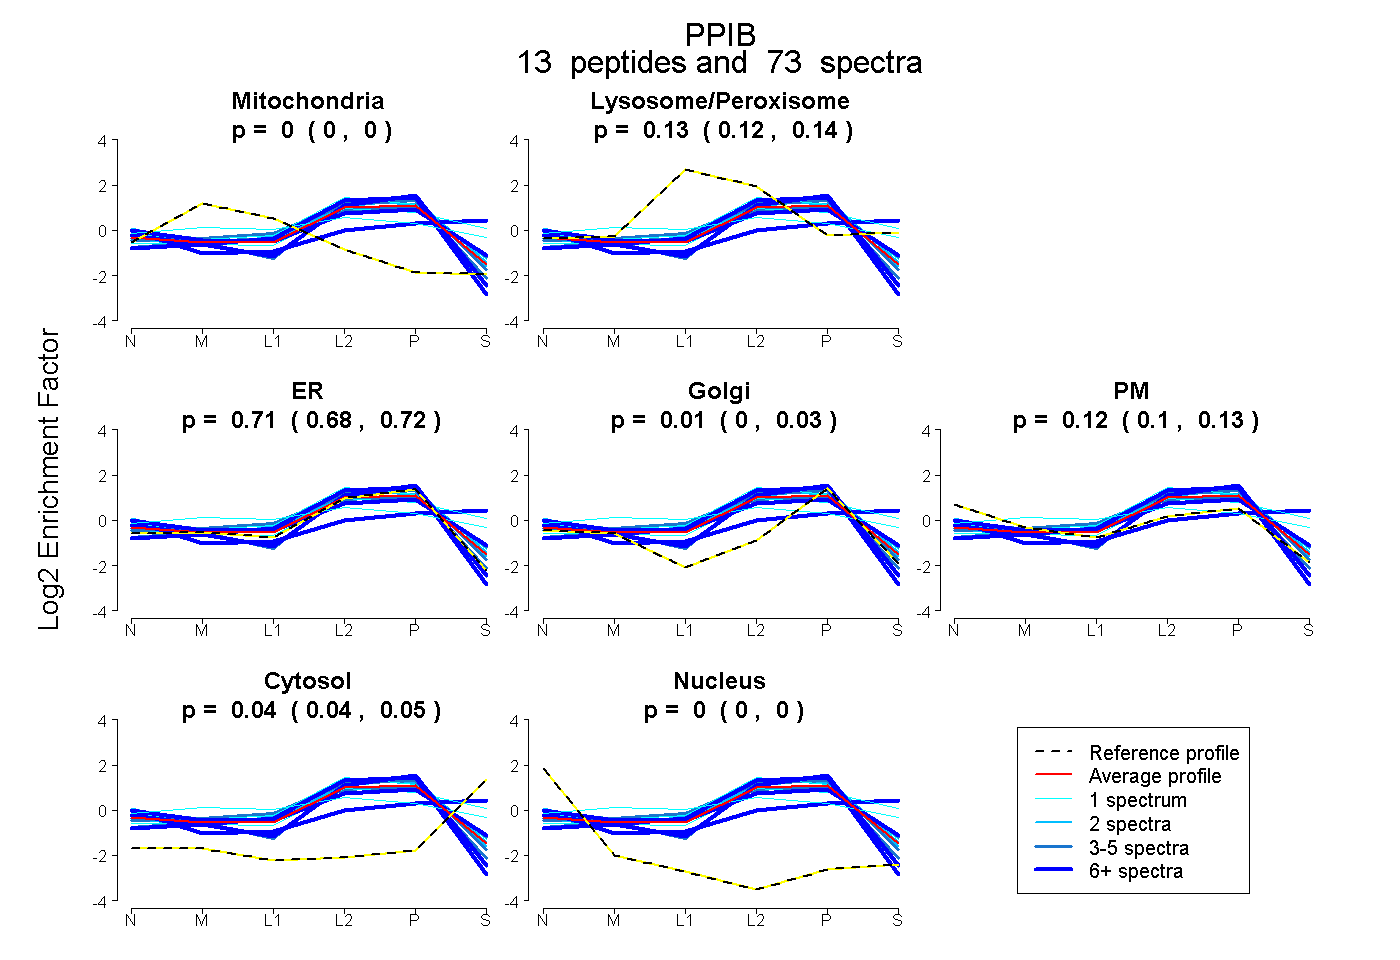
0.000 | 0.000
0.116 | 0.140
0.677 | 0.722
0.000 | 0.034
0.096 | 0.129
0.036 | 0.050
0.000 | 0.000