 13
13peptides
spectra
0.000 | 0.000
0.000 | 0.000
0.023 | 0.031
0.847 | 0.856
0.000 | 0.000
0.115 | 0.125
0.000 | 0.000
0.000 | 0.000
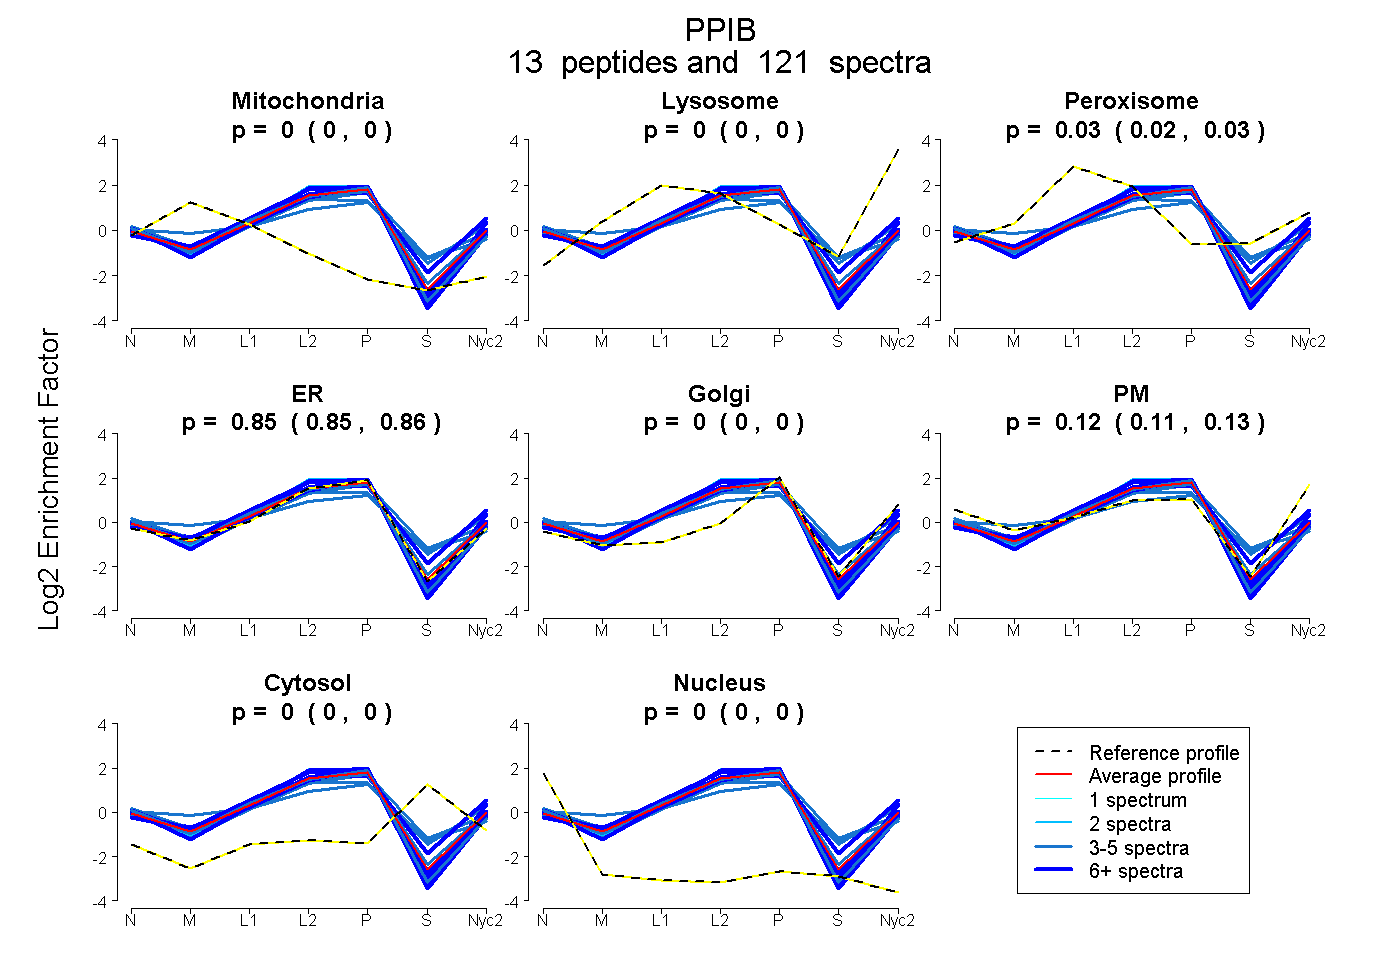
| Plot | Mito | Lyso | Perox | ER | Golgi | PM | Cytosol | Nucleus | |||||
| Expt A |
13 peptides |
121 spectra |
|
0.000 0.000 | 0.000 |
0.000 0.000 | 0.000 |
0.028 0.023 | 0.031 |
0.852 0.847 | 0.856 |
0.000 0.000 | 0.000 |
0.120 0.115 | 0.125 |
0.000 0.000 | 0.000 |
0.000 0.000 | 0.000 |
| 4 spectra, DTNGSQFFITTVK | 0.000 | 0.000 | 0.132 | 0.520 | 0.000 | 0.246 | 0.102 | 0.000 | ||
| 3 spectra, DVIIVDCGK | 0.067 | 0.000 | 0.180 | 0.564 | 0.079 | 0.000 | 0.109 | 0.000 | ||
| 18 spectra, VLEGMDVVR | 0.000 | 0.000 | 0.000 | 0.910 | 0.000 | 0.090 | 0.000 | 0.000 | ||
| 10 spectra, HYGPGWVSMANAGK | 0.000 | 0.034 | 0.077 | 0.611 | 0.000 | 0.246 | 0.033 | 0.000 | ||
| 4 spectra, GDGTGGK | 0.000 | 0.000 | 0.096 | 0.734 | 0.000 | 0.017 | 0.152 | 0.000 | ||
| 14 spectra, FPDENFK | 0.000 | 0.000 | 0.000 | 0.911 | 0.000 | 0.089 | 0.000 | 0.000 | ||
| 2 spectra, IEVEKPFAIAK | 0.000 | 0.000 | 0.036 | 0.964 | 0.000 | 0.000 | 0.000 | 0.000 | ||
| 18 spectra, VTFGLFGK | 0.000 | 0.000 | 0.000 | 0.909 | 0.000 | 0.091 | 0.000 | 0.000 | ||
| 5 spectra, TVDNFVALATGEK | 0.000 | 0.000 | 0.030 | 0.838 | 0.000 | 0.101 | 0.031 | 0.000 | ||
| 8 spectra, TSWLDGK | 0.000 | 0.030 | 0.000 | 0.819 | 0.000 | 0.151 | 0.000 | 0.000 | ||
| 5 spectra, VYFDFQIGDEPVGR | 0.000 | 0.000 | 0.000 | 0.960 | 0.000 | 0.036 | 0.000 | 0.004 | ||
| 15 spectra, DFMIQGGDFTR | 0.003 | 0.000 | 0.000 | 0.958 | 0.000 | 0.039 | 0.000 | 0.000 | ||
| 15 spectra, SIYGER | 0.000 | 0.000 | 0.002 | 0.931 | 0.000 | 0.061 | 0.000 | 0.006 |
| Plot | Mito | Lyso or Perox | ER | Golgi | PM | Cytosol | Nucleus | ||||||
| Expt B |
13 peptides |
73 spectra |
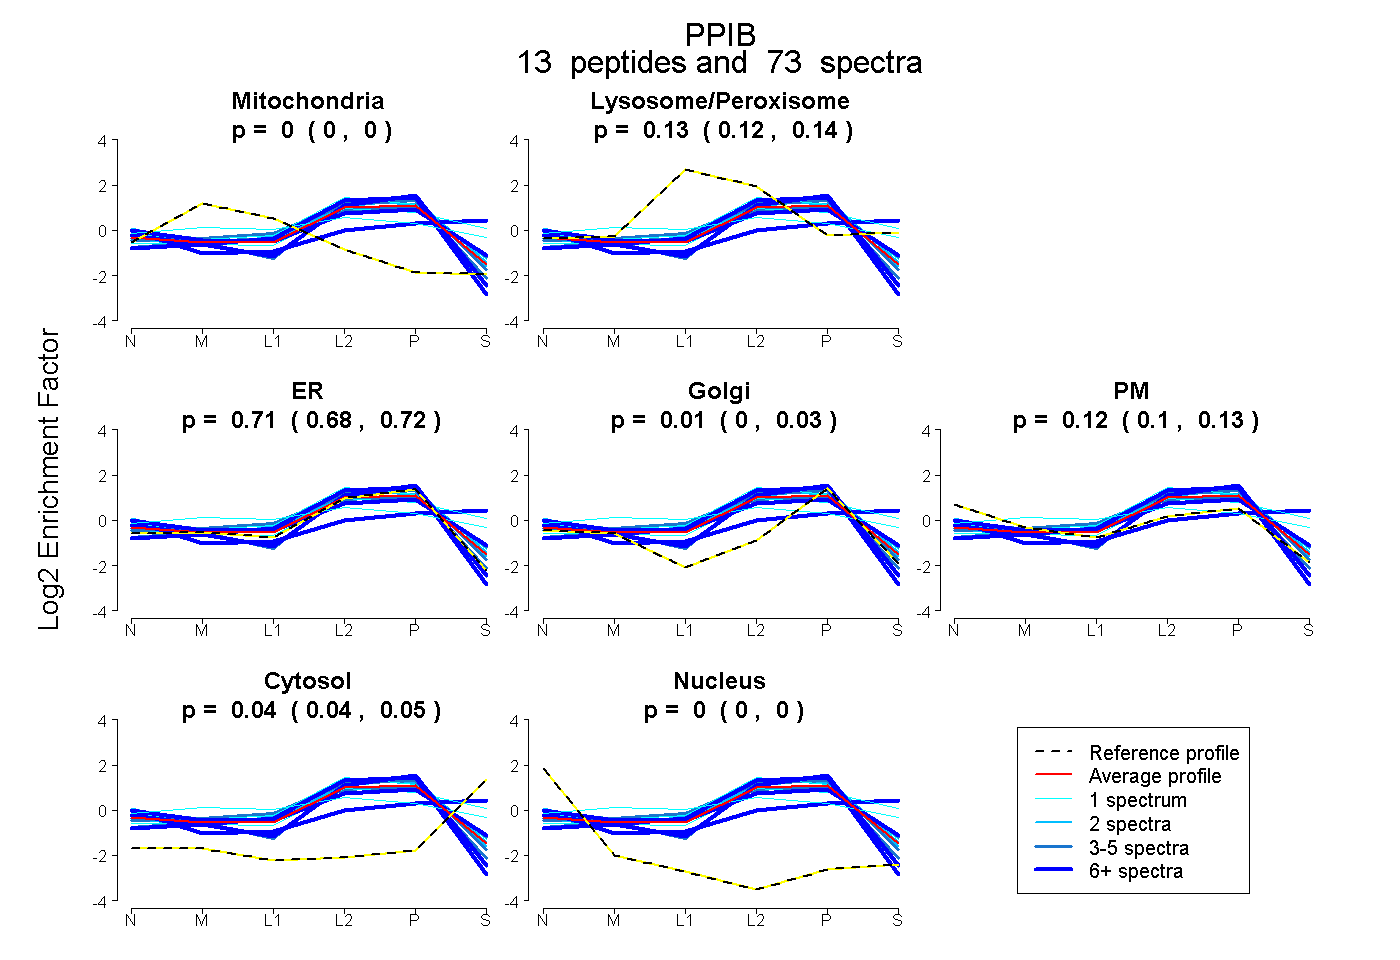 |
0.000 0.000 | 0.000 |
0.126 0.116 | 0.140 |
0.707 0.677 | 0.722 |
0.006 0.000 | 0.034 |
0.116 0.096 | 0.129 |
0.045 0.036 | 0.050 |
0.000 0.000 | 0.000 |
|||
| Plot | Lyso | Other | |||||||||||
| Expt C |
14 peptides |
324 spectra |
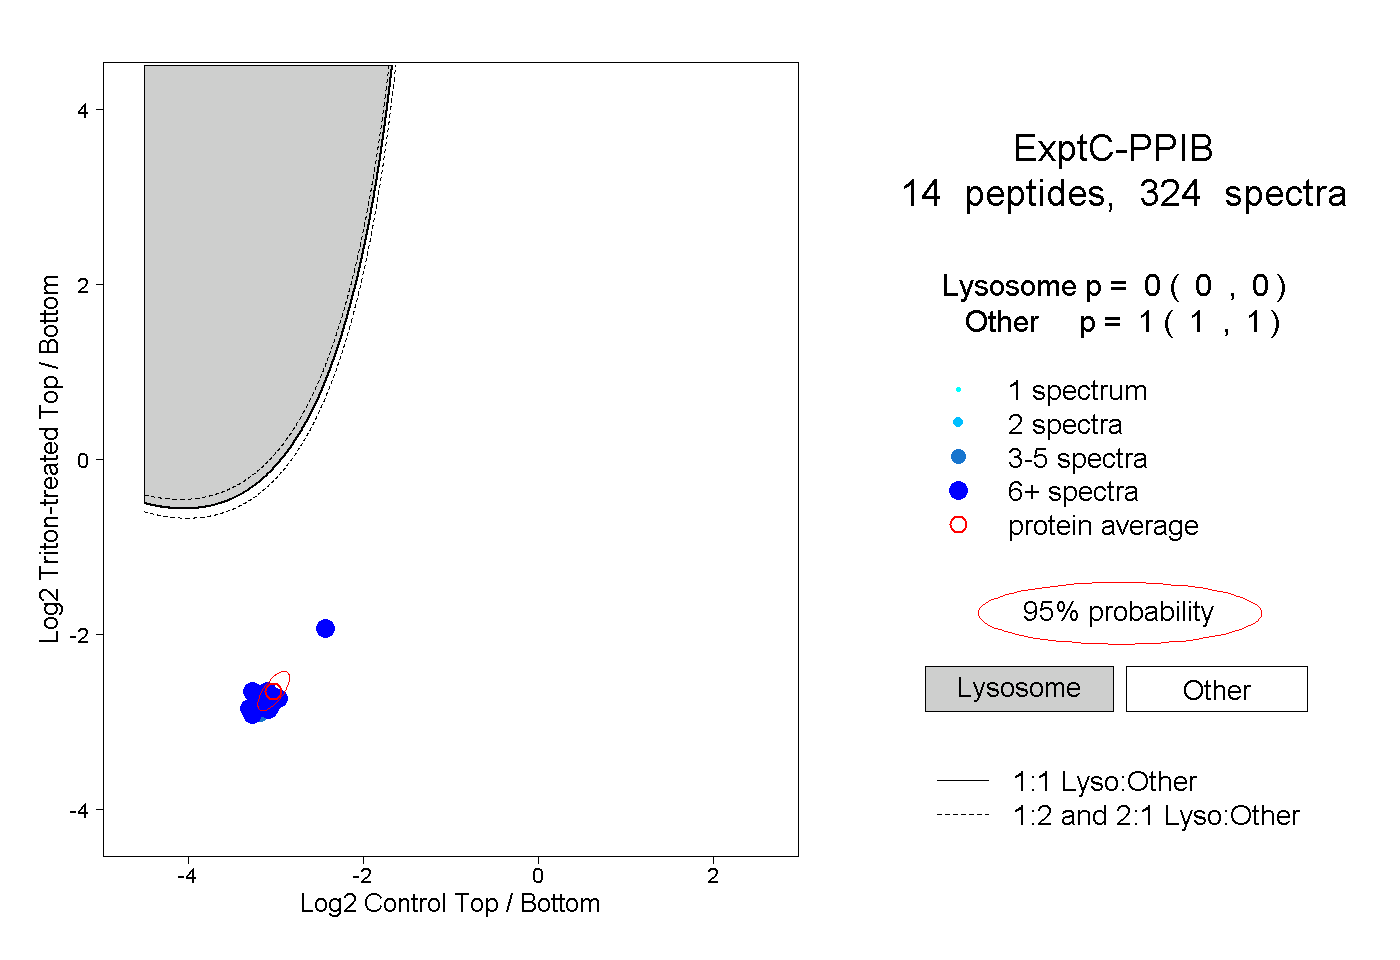 |
0.000 0.000 | 0.000 |
1.000 1.000 | 1.000 |
||||||||
| Plot | Lyso | Other | |||||||||||
| Expt D |
6 peptides |
29 spectra |
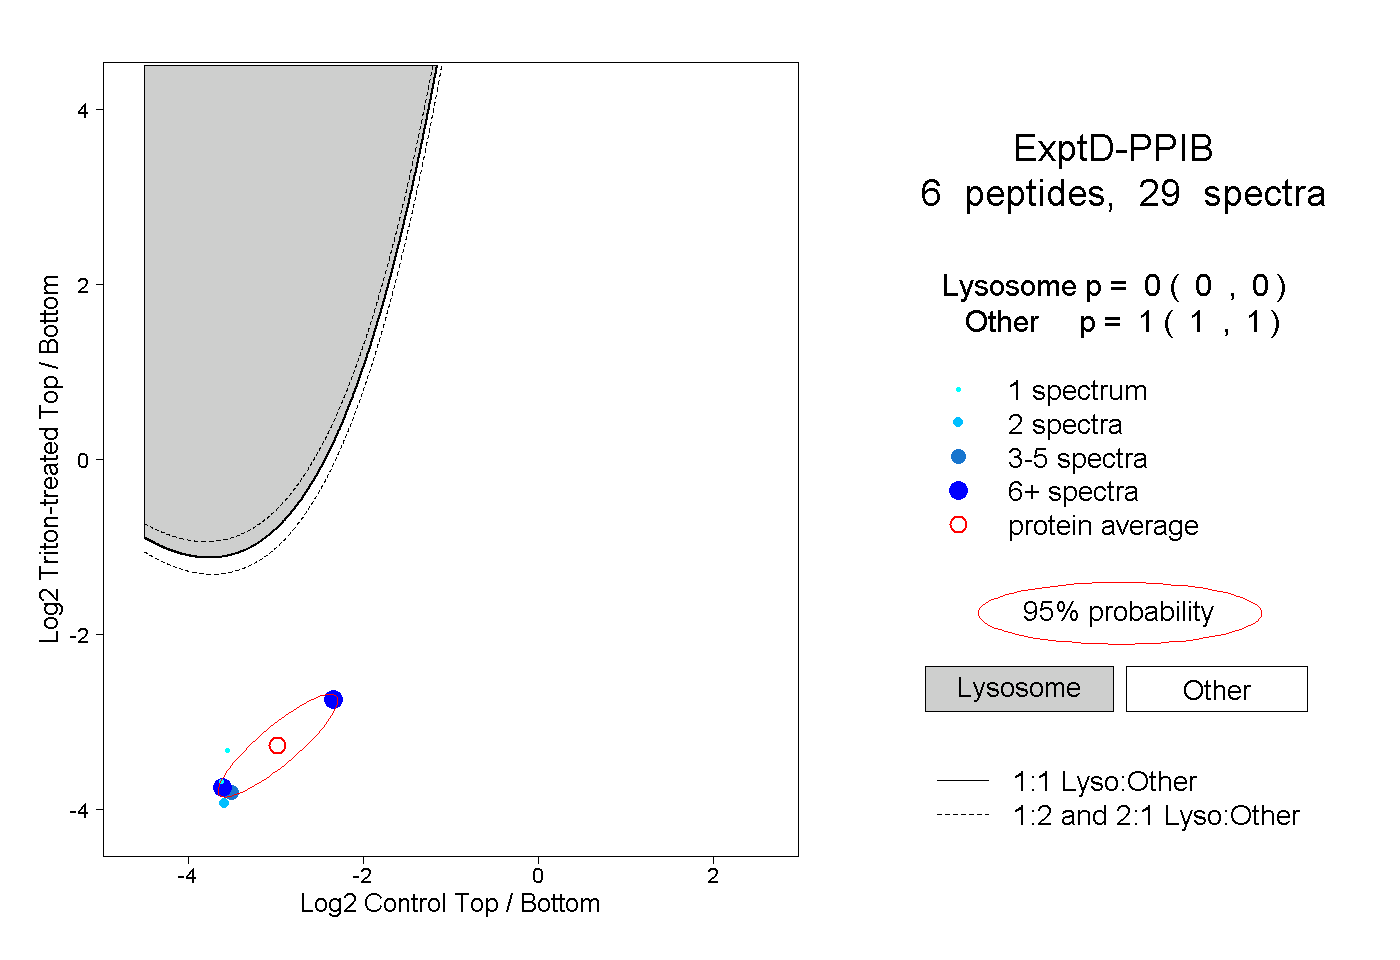 |
0.000 0.000 | 0.000 |
1.000 1.000 | 1.000 |