 3
3peptides
spectra
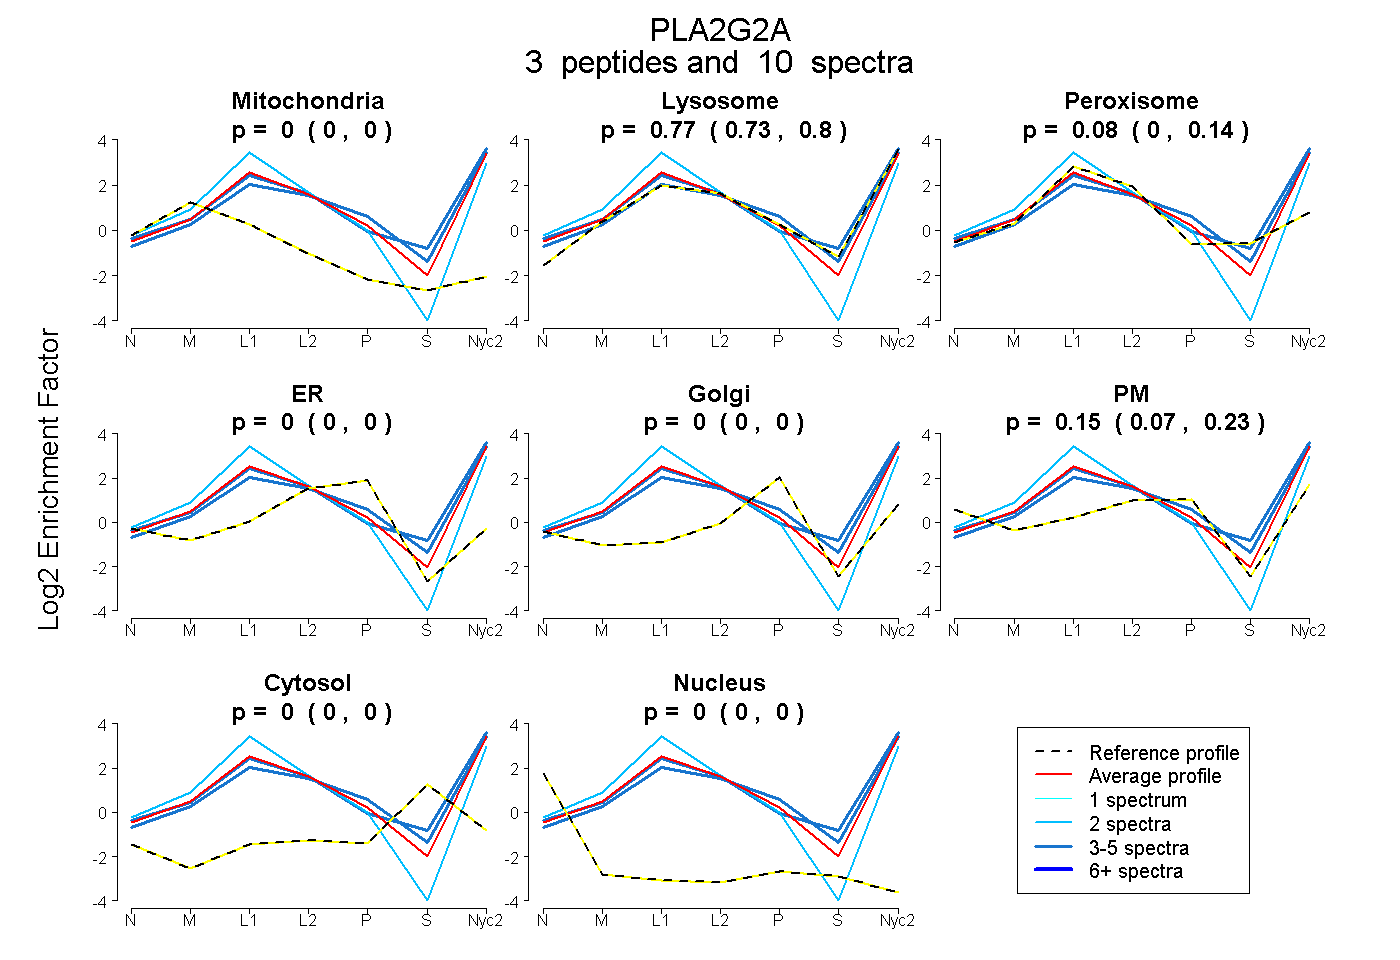
0.000 | 0.000
0.726 | 0.796
0.000 | 0.143
0.000 | 0.000
0.000 | 0.000
0.071 | 0.228
0.000 | 0.000
0.000 | 0.000
1peptide
spectra
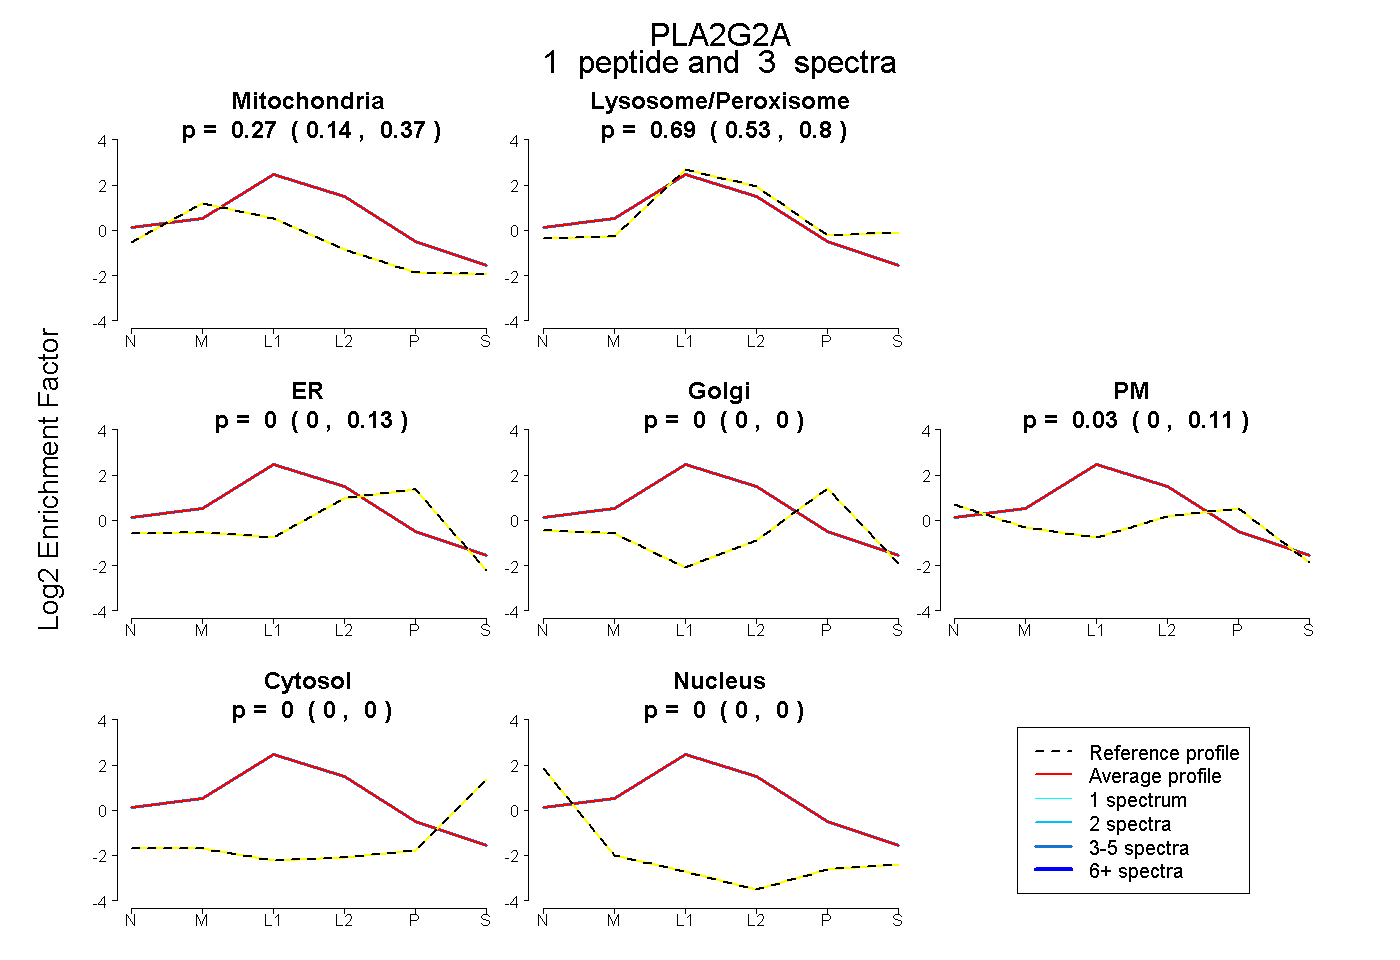
0.139 | 0.365
0.534 | 0.800
0.000 | 0.134
0.000 | 0.000
0.000 | 0.111
0.000 | 0.000
0.000 | 0.000
4peptides
spectra
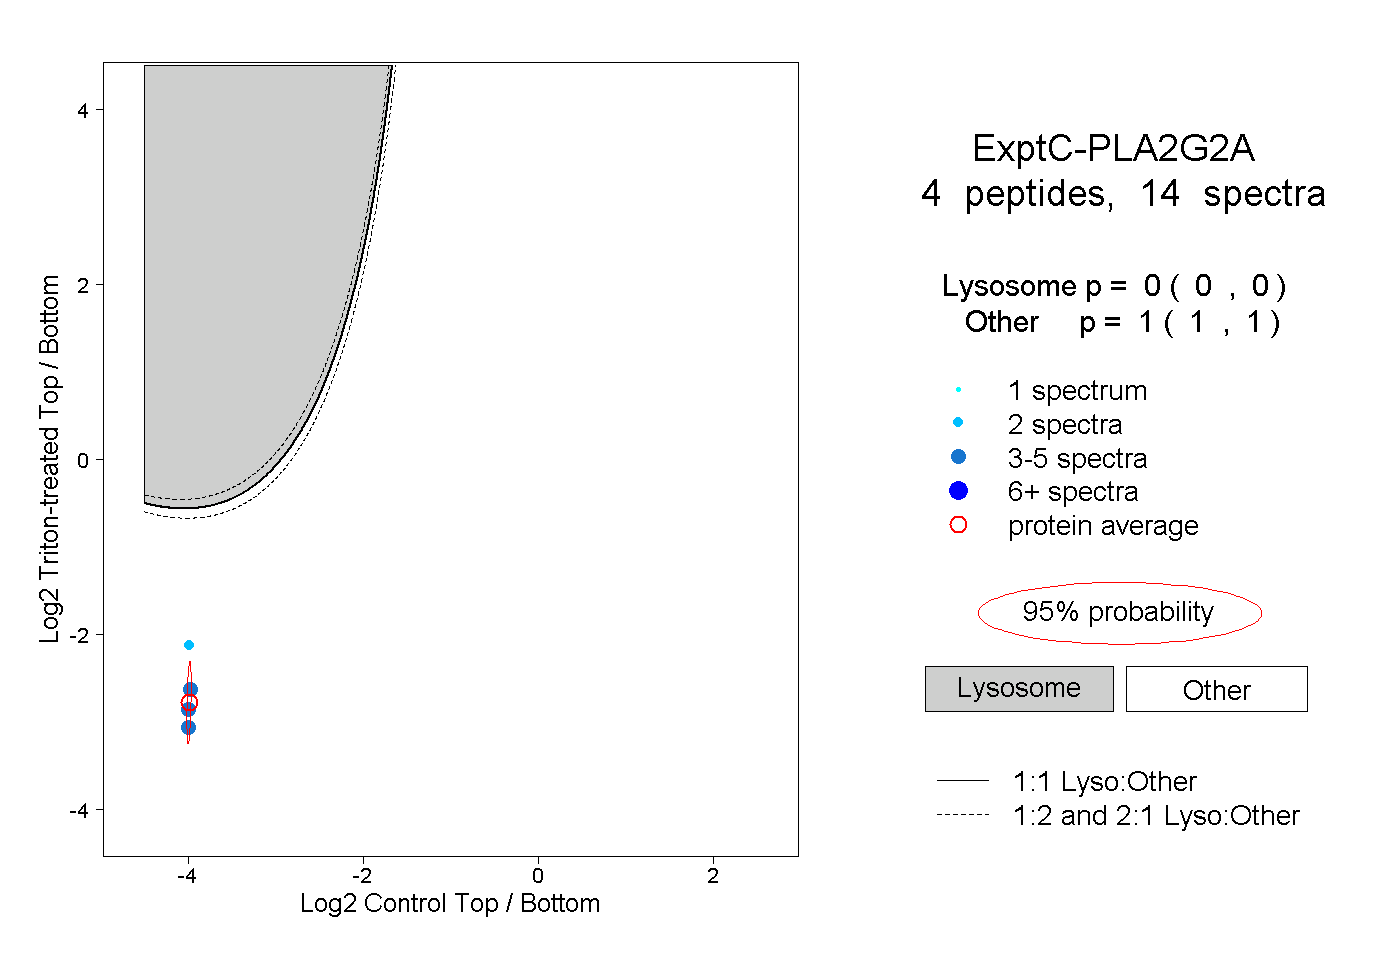
0.000 | 0.000
1.000 | 1.000