 2
2peptides
spectra
0.390 | 0.490
0.173 | 0.298
0.002 | 0.207
0.000 | 0.000
0.000 | 0.000
0.139 | 0.242
0.000 | 0.000
0.000 | 0.000
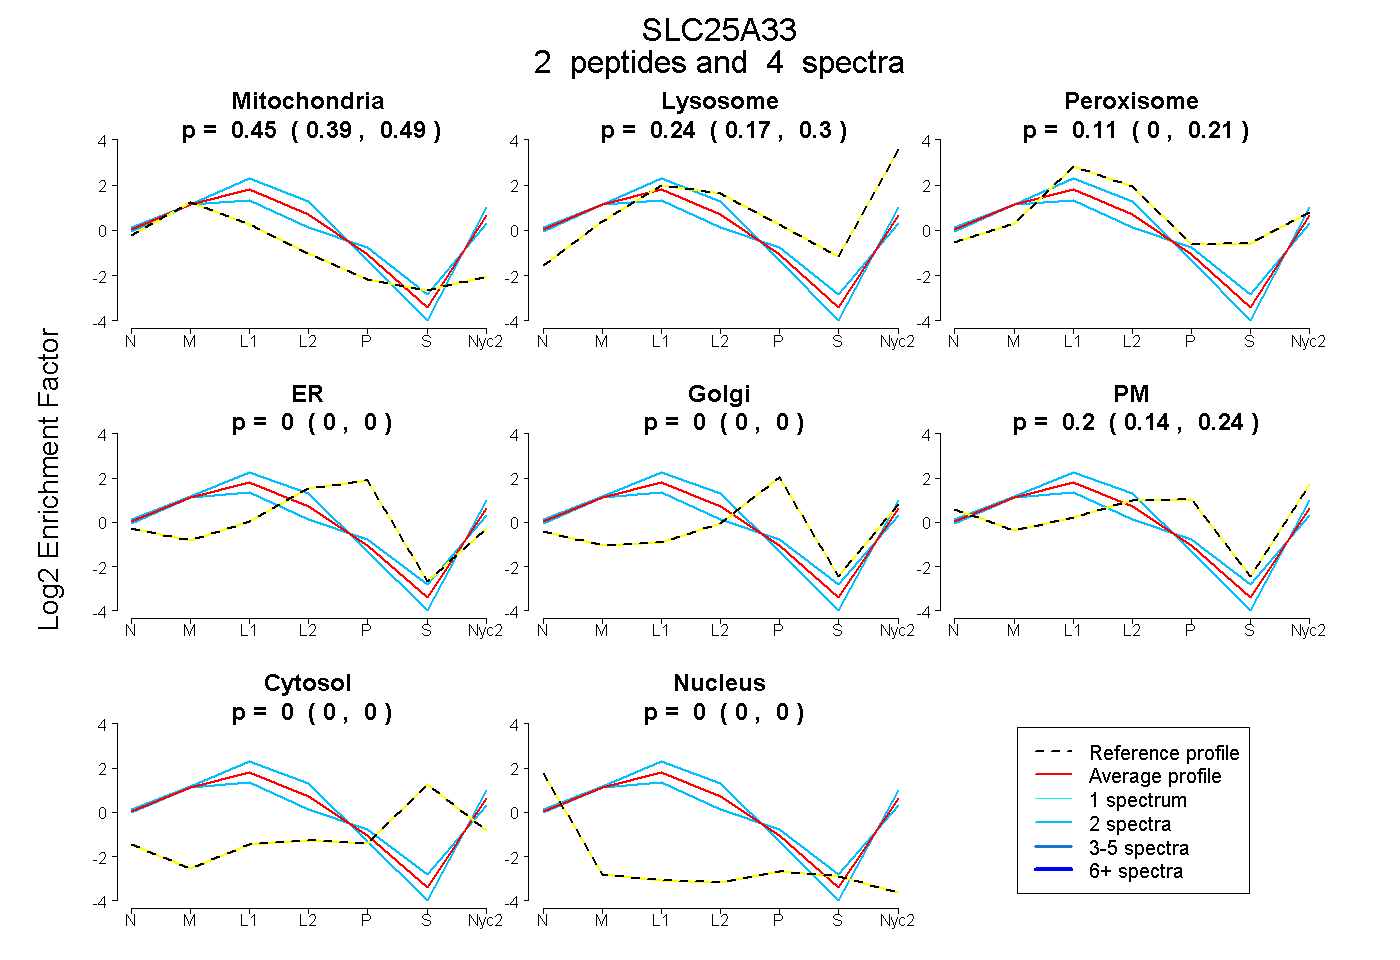
| Plot | Mito | Lyso | Perox | ER | Golgi | PM | Cytosol | Nucleus | |||||
| Expt A |
2 peptides |
4 spectra |
|
0.448 0.390 | 0.490 |
0.244 0.173 | 0.298 |
0.111 0.002 | 0.207 |
0.000 0.000 | 0.000 |
0.000 0.000 | 0.000 |
0.197 0.139 | 0.242 |
0.000 0.000 | 0.000 |
0.000 0.000 | 0.000 |
| 2 spectra, GLFAQLIR | 0.510 | 0.222 | 0.047 | 0.000 | 0.000 | 0.221 | 0.000 | 0.000 | ||
| 2 spectra, GLGPNLVGVAPSR | 0.386 | 0.266 | 0.176 | 0.000 | 0.000 | 0.173 | 0.000 | 0.000 |
| Plot | Lyso | Other | |||||||||||
| Expt C |
2 peptides |
4 spectra |
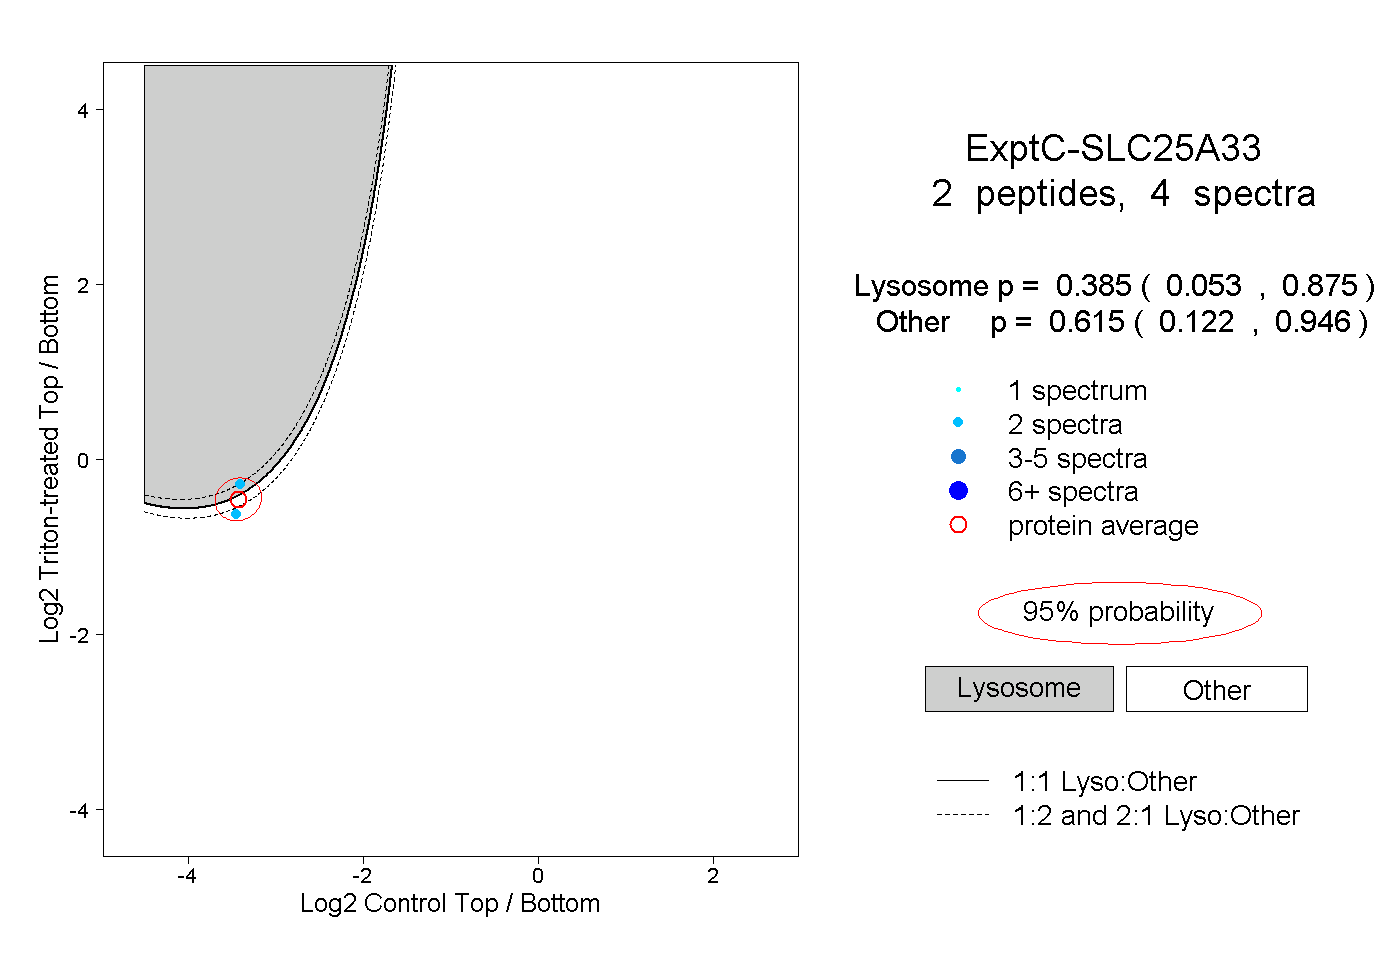 |
0.385 0.053 | 0.875 |
0.615 0.122 | 0.946 |