 2
2peptides
spectra
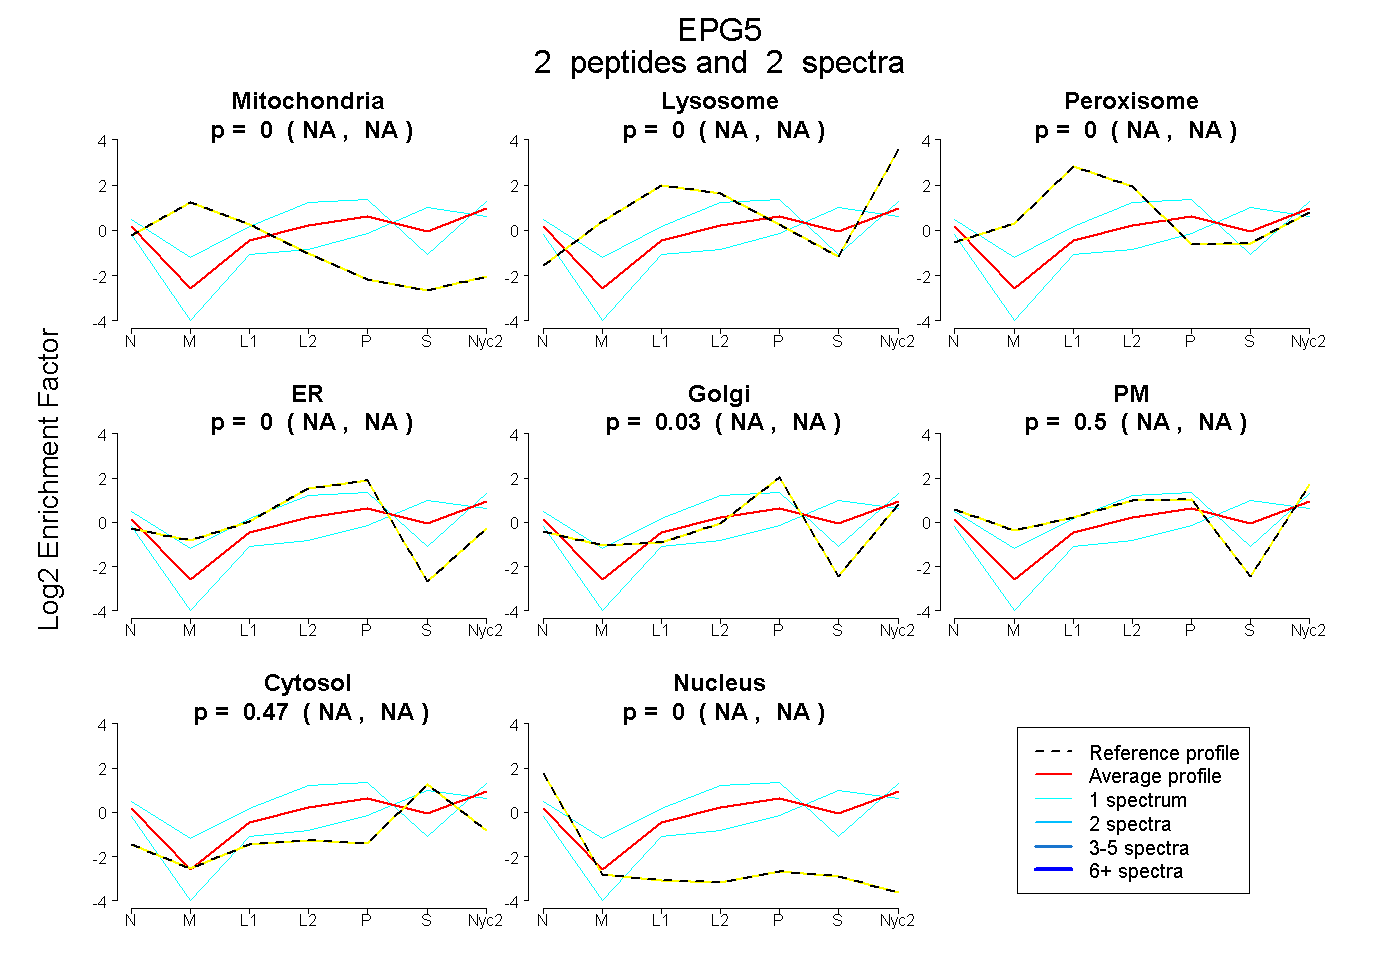
NA | NA
NA | NA
NA | NA
NA | NA
NA | NA
NA | NA
NA | NA
NA | NA
| Plot | Mito | Lyso | Perox | ER | Golgi | PM | Cytosol | Nucleus | |||||
| Expt A |
2 peptides |
2 spectra |
|
0.000 NA | NA |
0.000 NA | NA |
0.000 NA | NA |
0.000 NA | NA |
0.027 NA | NA |
0.499 NA | NA |
0.473 NA | NA |
0.000 NA | NA |
| 1 spectrum, GEVAAR | 0.000 | 0.035 | 0.039 | 0.148 | 0.000 | 0.639 | 0.139 | 0.000 | ||
| 1 spectrum, DGDDEIELK | 0.000 | 0.000 | 0.000 | 0.000 | 0.086 | 0.133 | 0.782 | 0.000 |
| Plot | Lyso | Other | |||||||||||
| Expt C |
2 peptides |
3 spectra |
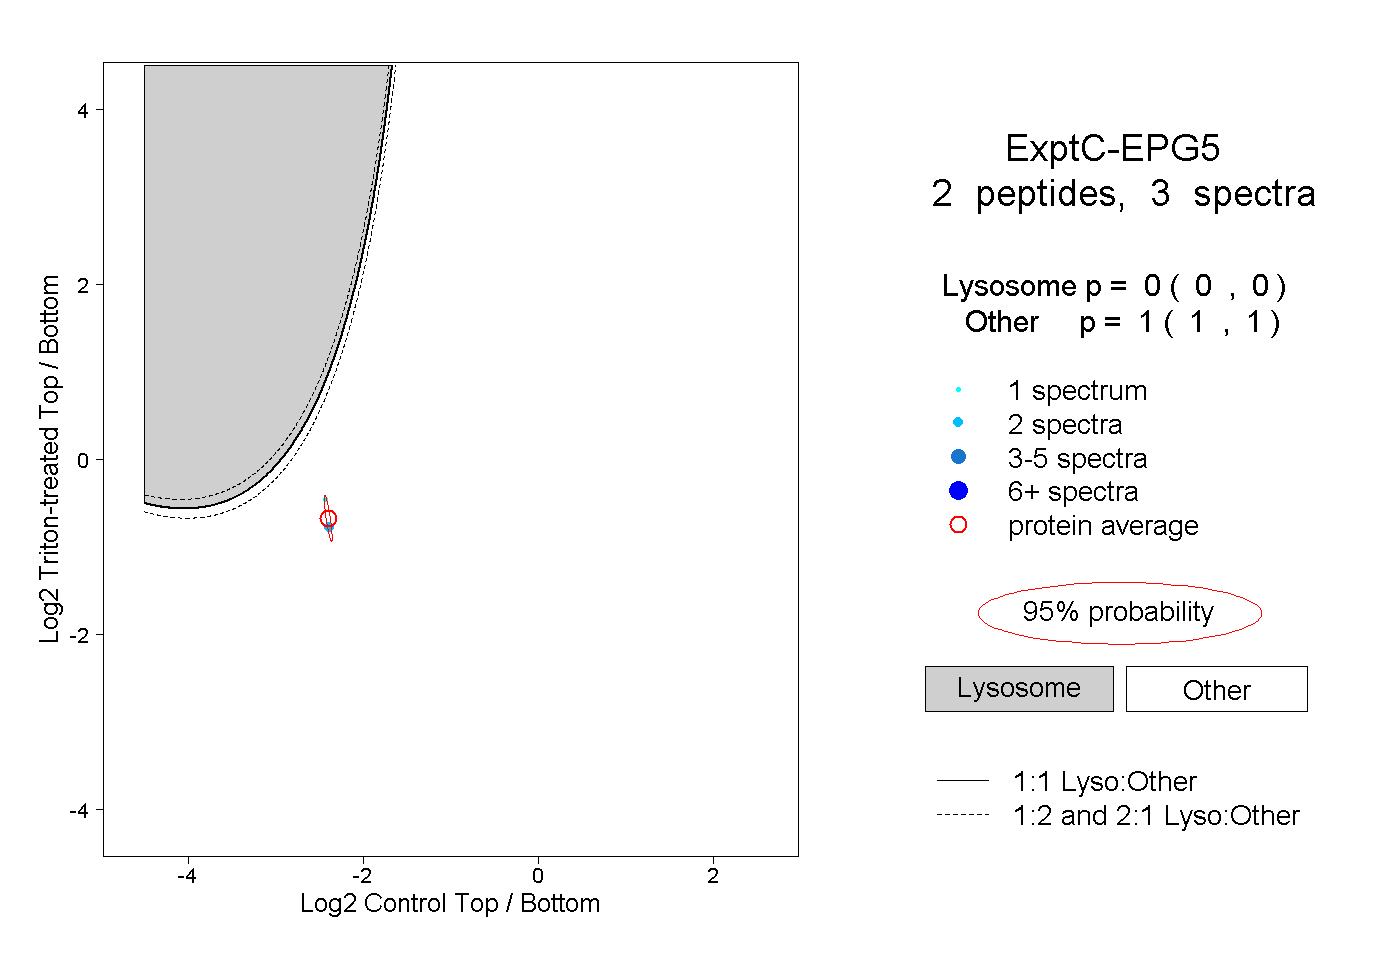 |
0.000 0.000 | 0.000 |
1.000 1.000 | 1.000 |