11
11peptides
spectra
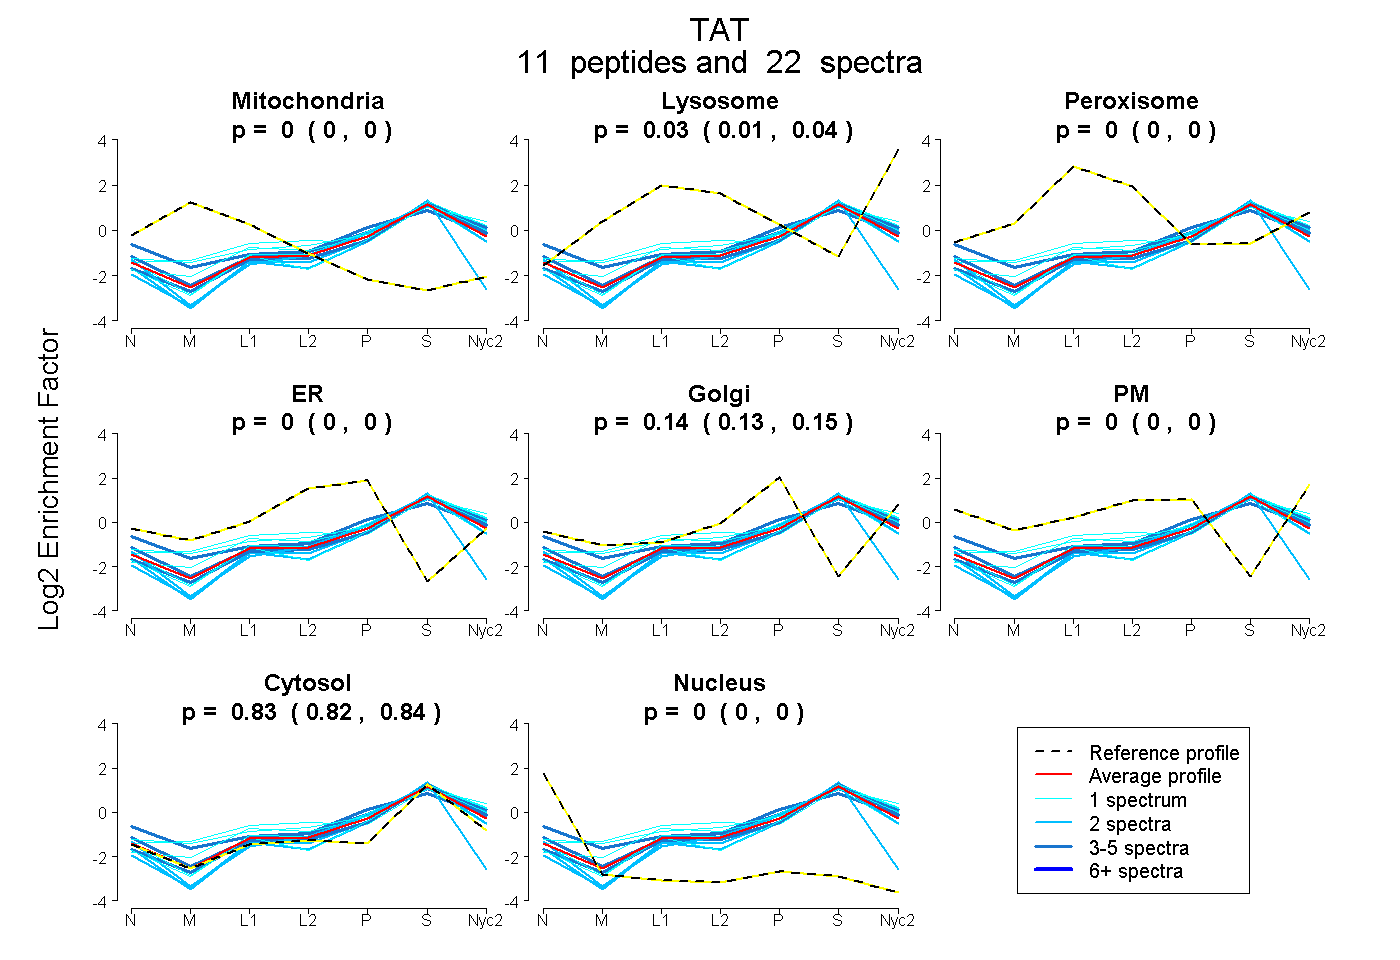
0.000 | 0.000
0.011 | 0.037
0.000 | 0.000
0.000 | 0.000
0.133 | 0.149
0.000 | 0.000
0.824 | 0.840
0.000 | 0.000
4peptides
spectra
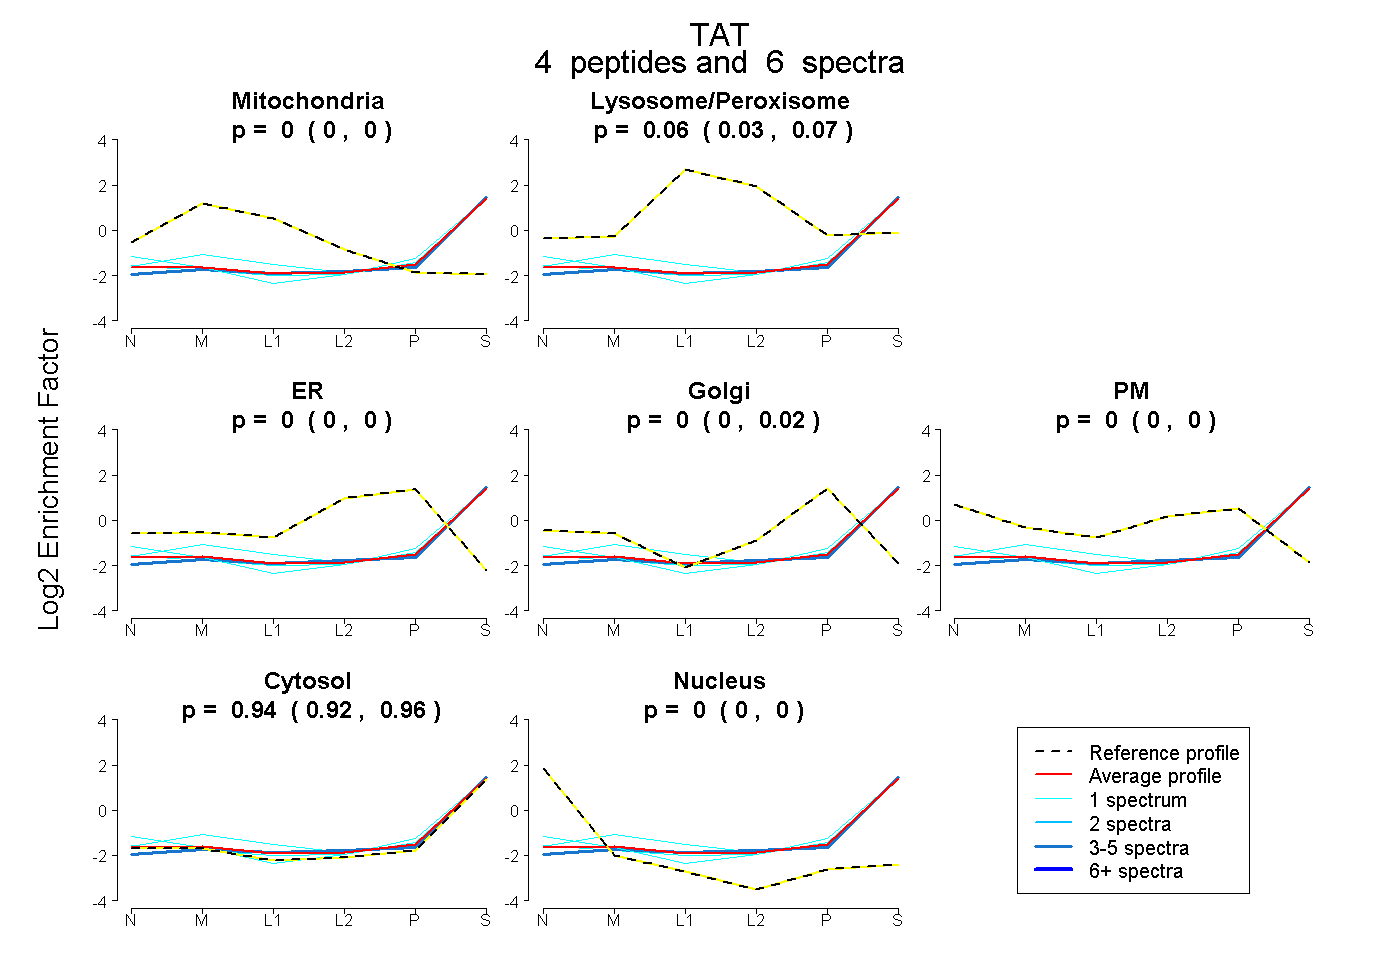
0.000 | 0.000
0.034 | 0.073
0.000 | 0.003
0.000 | 0.017
0.000 | 0.000
0.922 | 0.955
0.000 | 0.000
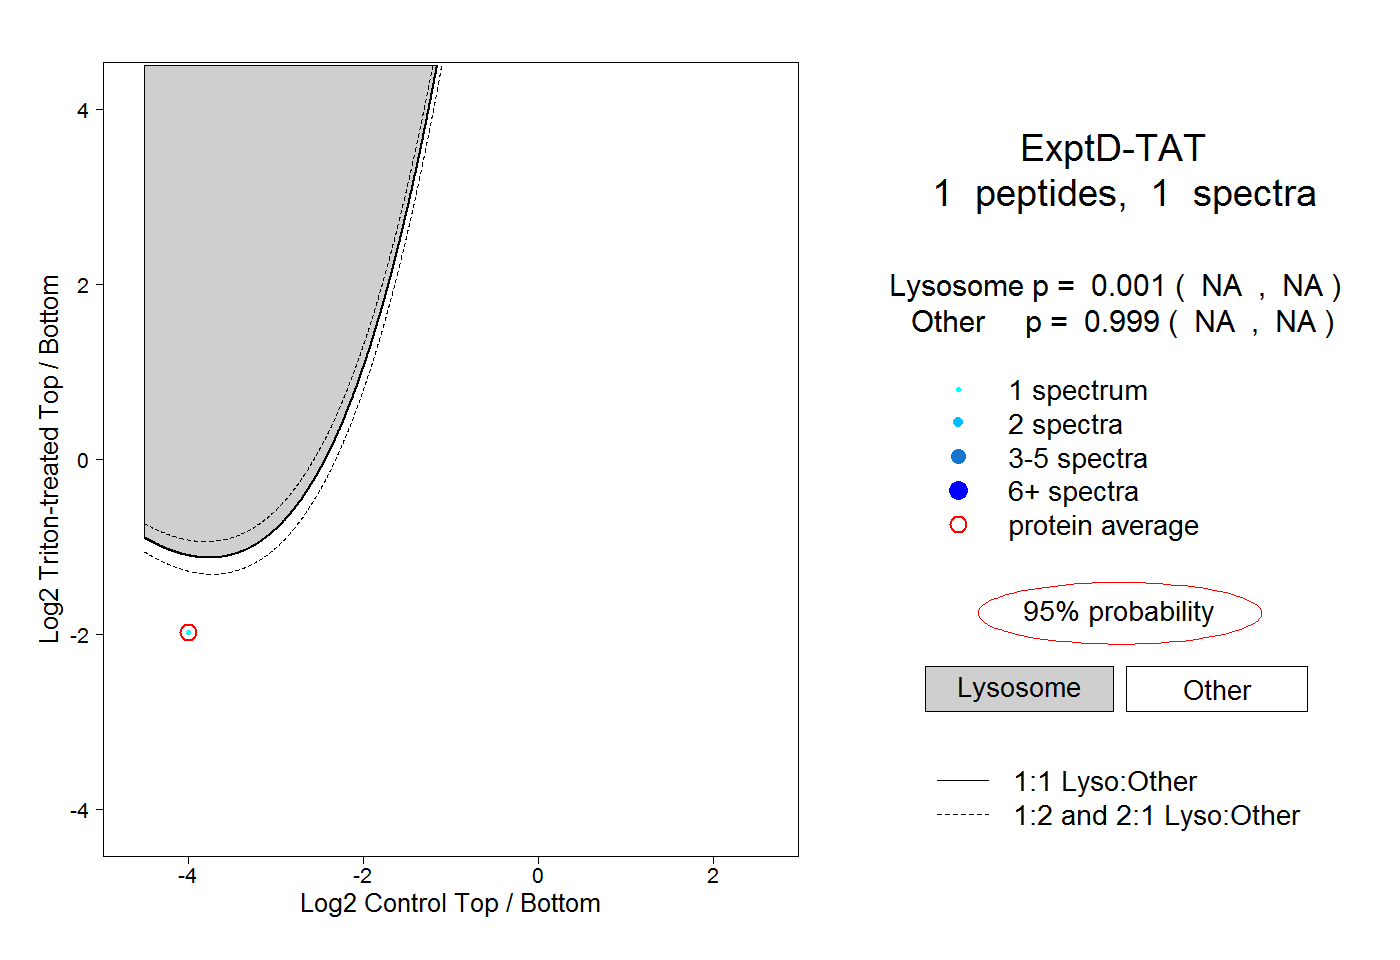
12peptides
spectra
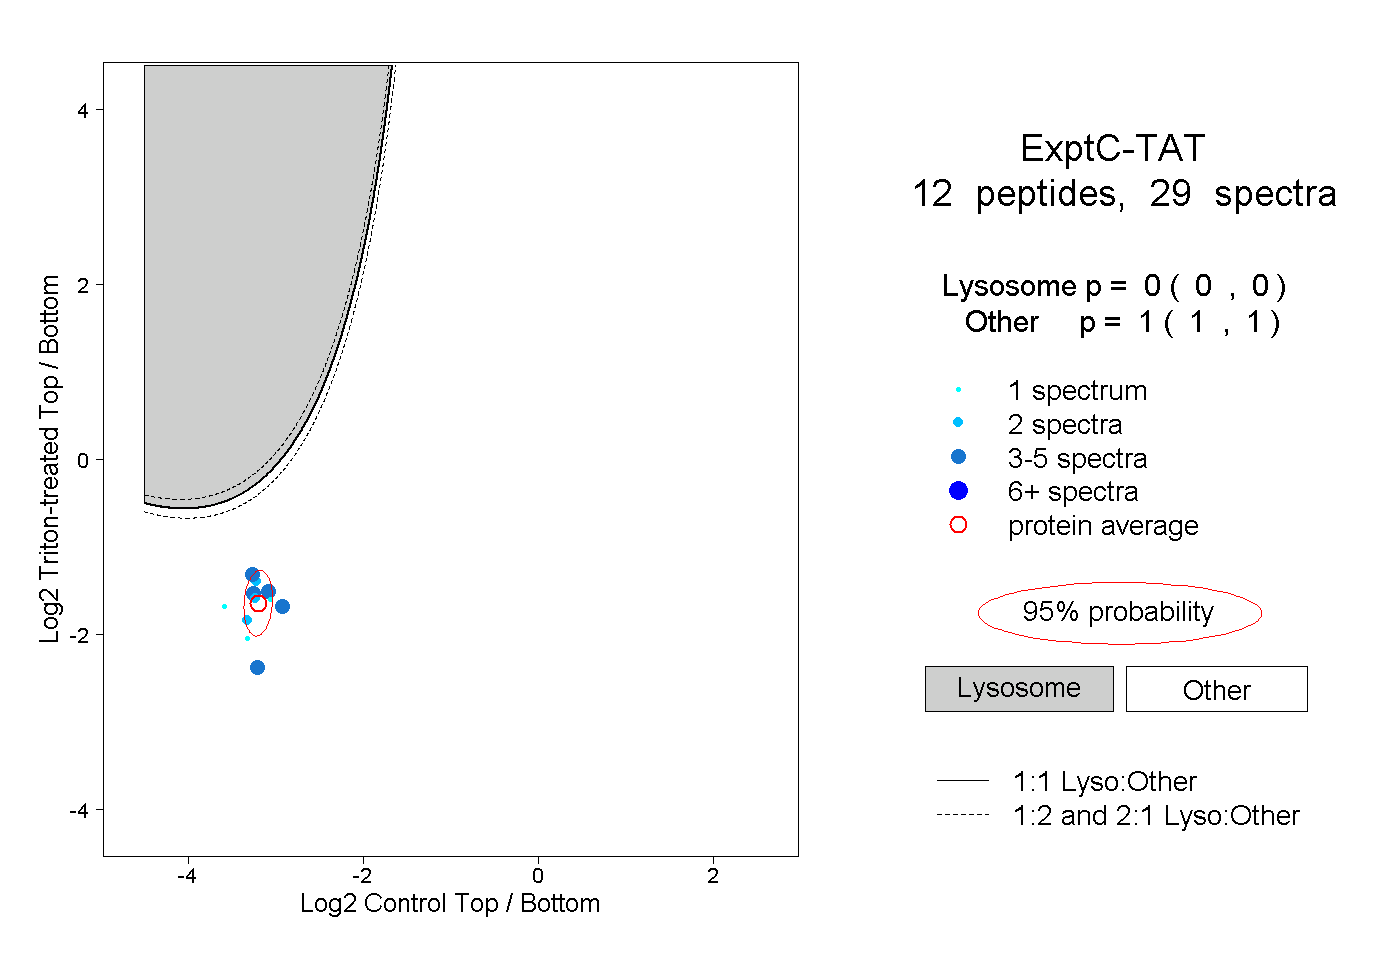
0.000 | 0.000
1.000 | 1.000