 11
11peptides
spectra
0.000 | 0.000
0.011 | 0.037
0.000 | 0.000
0.000 | 0.000
0.133 | 0.149
0.000 | 0.000
0.824 | 0.840
0.000 | 0.000
| Plot | Mito | Lyso | Perox | ER | Golgi | PM | Cytosol | Nucleus | |||||
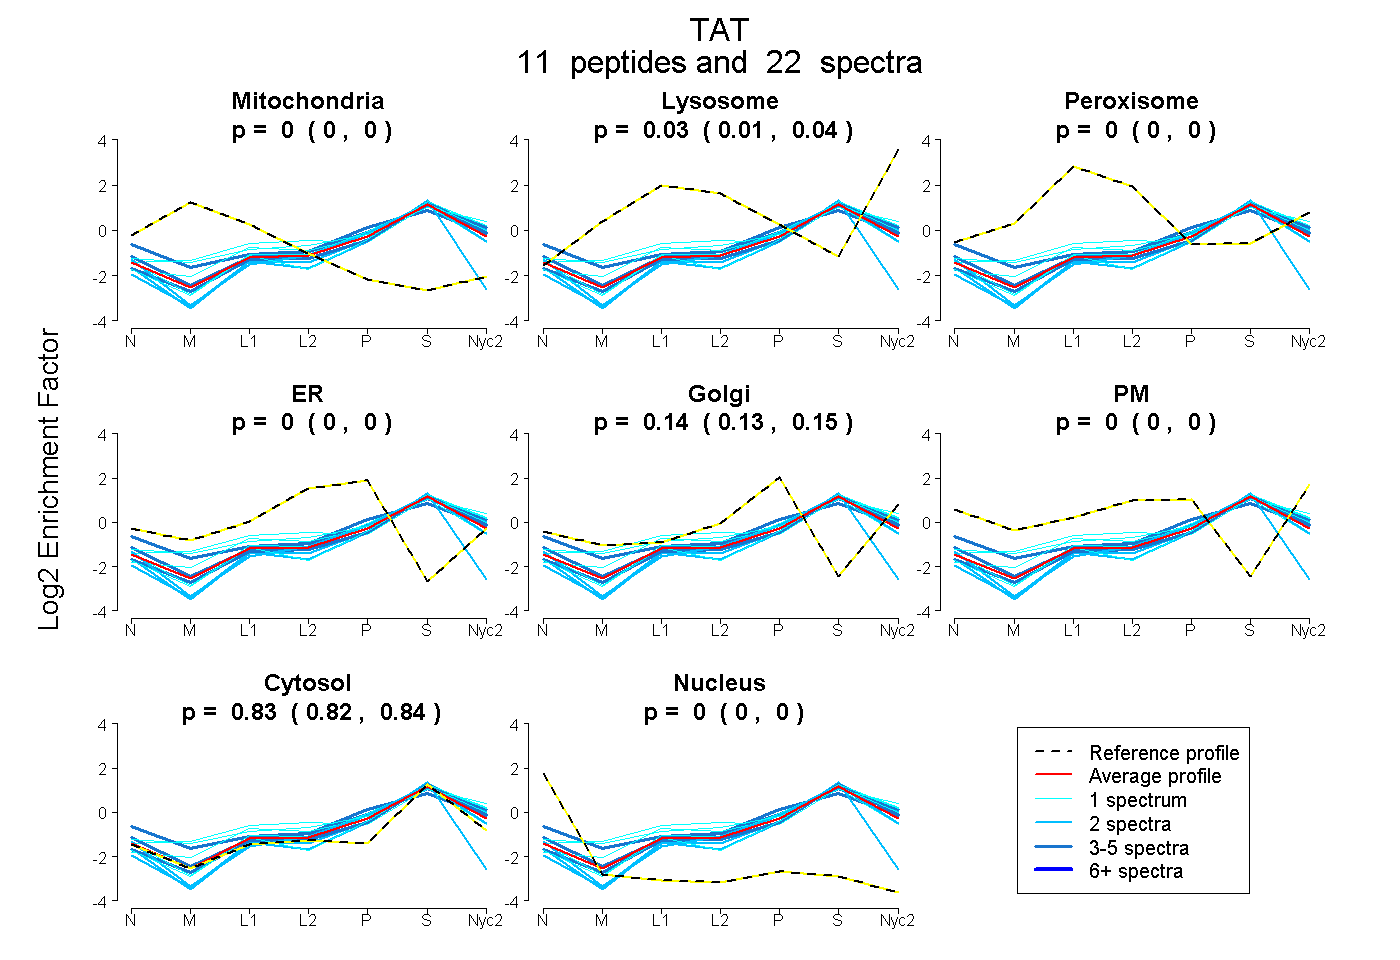
| Expt A |
11 peptides |
22 spectra |
|
0.000 0.000 | 0.000 |
0.026 0.011 | 0.037 |
0.000 0.000 | 0.000 |
0.000 0.000 | 0.000 |
0.141 0.133 | 0.149 |
0.000 0.000 | 0.000 |
0.833 0.824 | 0.840 |
0.000 0.000 | 0.000 |
| 1 spectrum, YNGYAPSIGYLSSR | 0.000 | 0.055 | 0.000 | 0.000 | 0.063 | 0.000 | 0.882 | 0.000 | ||
| 1 spectrum, WDVRPSDMSNK | 0.000 | 0.210 | 0.000 | 0.000 | 0.101 | 0.000 | 0.689 | 0.000 | ||
| 1 spectrum, LYNLLPEK | 0.000 | 0.185 | 0.000 | 0.000 | 0.032 | 0.000 | 0.783 | 0.000 | ||
| 2 spectra, TLAESMGIEVK | 0.000 | 0.000 | 0.000 | 0.000 | 0.124 | 0.000 | 0.876 | 0.000 | ||
| 1 spectrum, ILGPCTIVQGALK | 0.000 | 0.035 | 0.173 | 0.062 | 0.000 | 0.000 | 0.731 | 0.000 | ||
| 4 spectra, AIVDNMK | 0.000 | 0.005 | 0.032 | 0.000 | 0.243 | 0.043 | 0.676 | 0.000 | ||
| 4 spectra, LGWILIHDR | 0.000 | 0.060 | 0.000 | 0.000 | 0.170 | 0.000 | 0.769 | 0.000 | ||
| 3 spectra, QLESLIDEK | 0.000 | 0.040 | 0.000 | 0.000 | 0.086 | 0.000 | 0.874 | 0.000 | ||
| 2 spectra, DIFGNEIR | 0.000 | 0.000 | 0.000 | 0.000 | 0.087 | 0.000 | 0.913 | 0.000 | ||
| 1 spectrum, SWEIDLK | 0.000 | 0.041 | 0.000 | 0.000 | 0.153 | 0.000 | 0.806 | 0.000 | ||
| 2 spectra, LIAEQAVHCLPATCFEYPNFFR | 0.000 | 0.000 | 0.000 | 0.000 | 0.000 | 0.000 | 0.940 | 0.060 |
| Plot | Mito | Lyso or Perox | ER | Golgi | PM | Cytosol | Nucleus | ||||||
| Expt B |
4 peptides |
6 spectra |
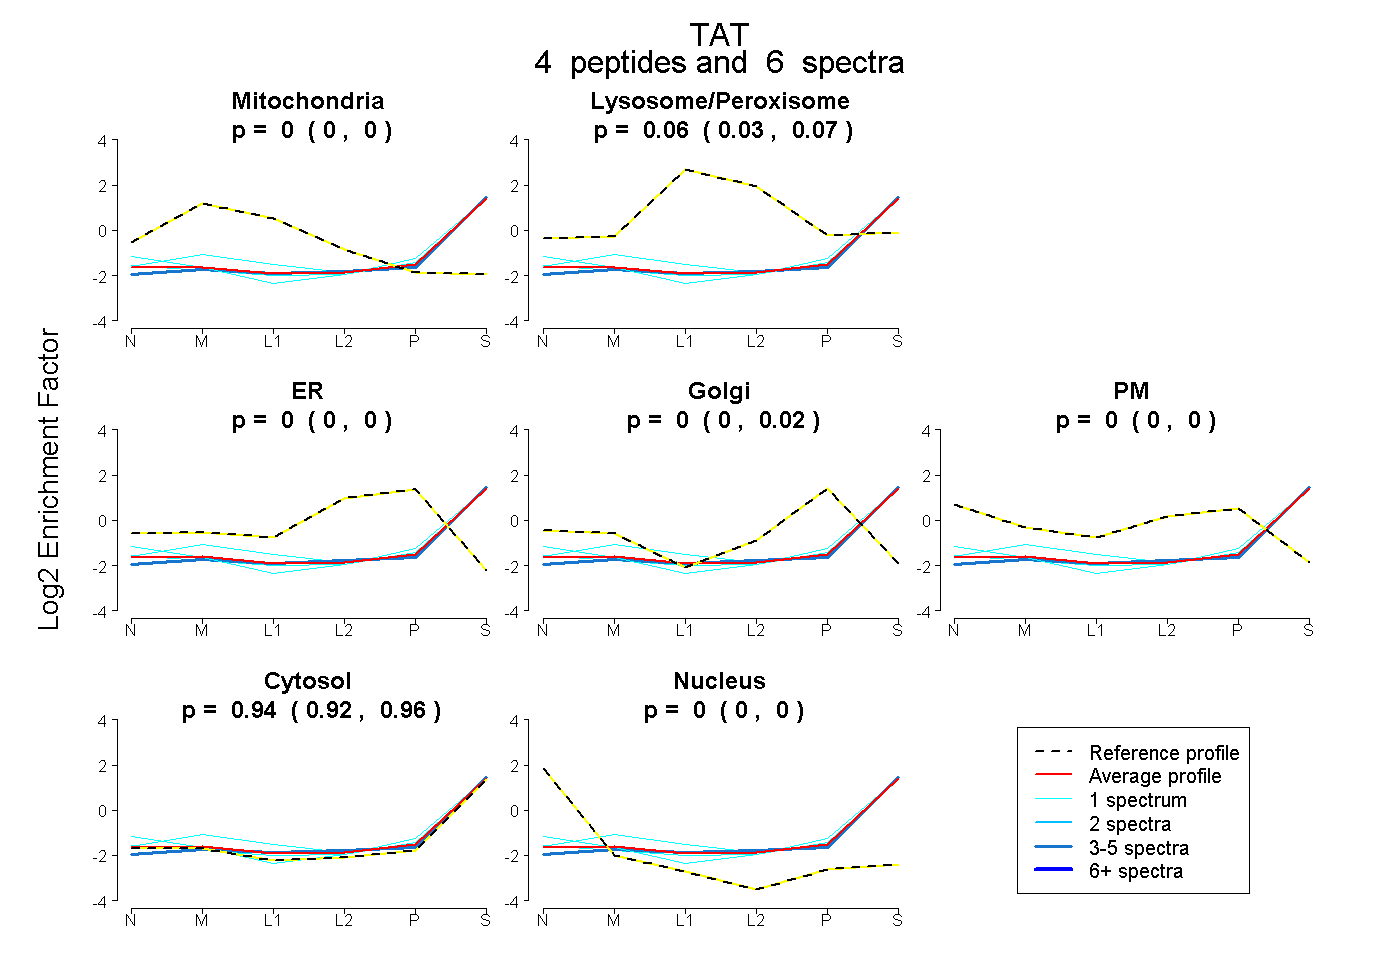 |
0.000 0.000 | 0.000 |
0.058 0.034 | 0.073 |
0.000 0.000 | 0.003 |
0.000 0.000 | 0.017 |
0.000 0.000 | 0.000 |
0.942 0.922 | 0.955 |
0.000 0.000 | 0.000 |
|||
| Plot | Lyso | Other | |||||||||||
| Expt C |
12 peptides |
29 spectra |
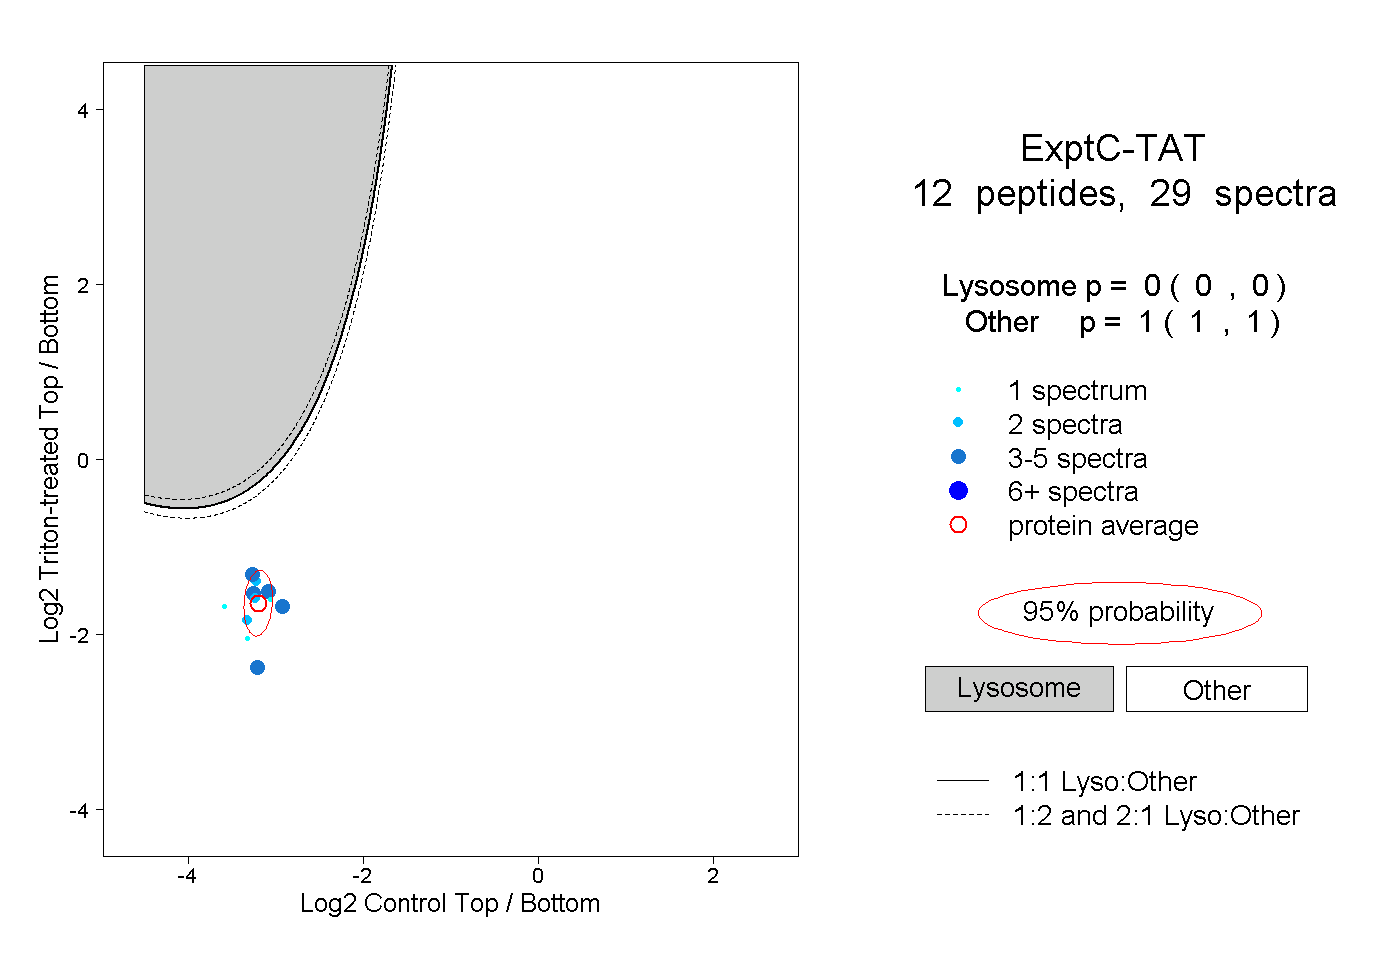 |
0.000 0.000 | 0.000 |
1.000 1.000 | 1.000 |
||||||||
| Plot | Lyso | Other | |||||||||||
| Expt D |
1 peptide |
1 spectrum |
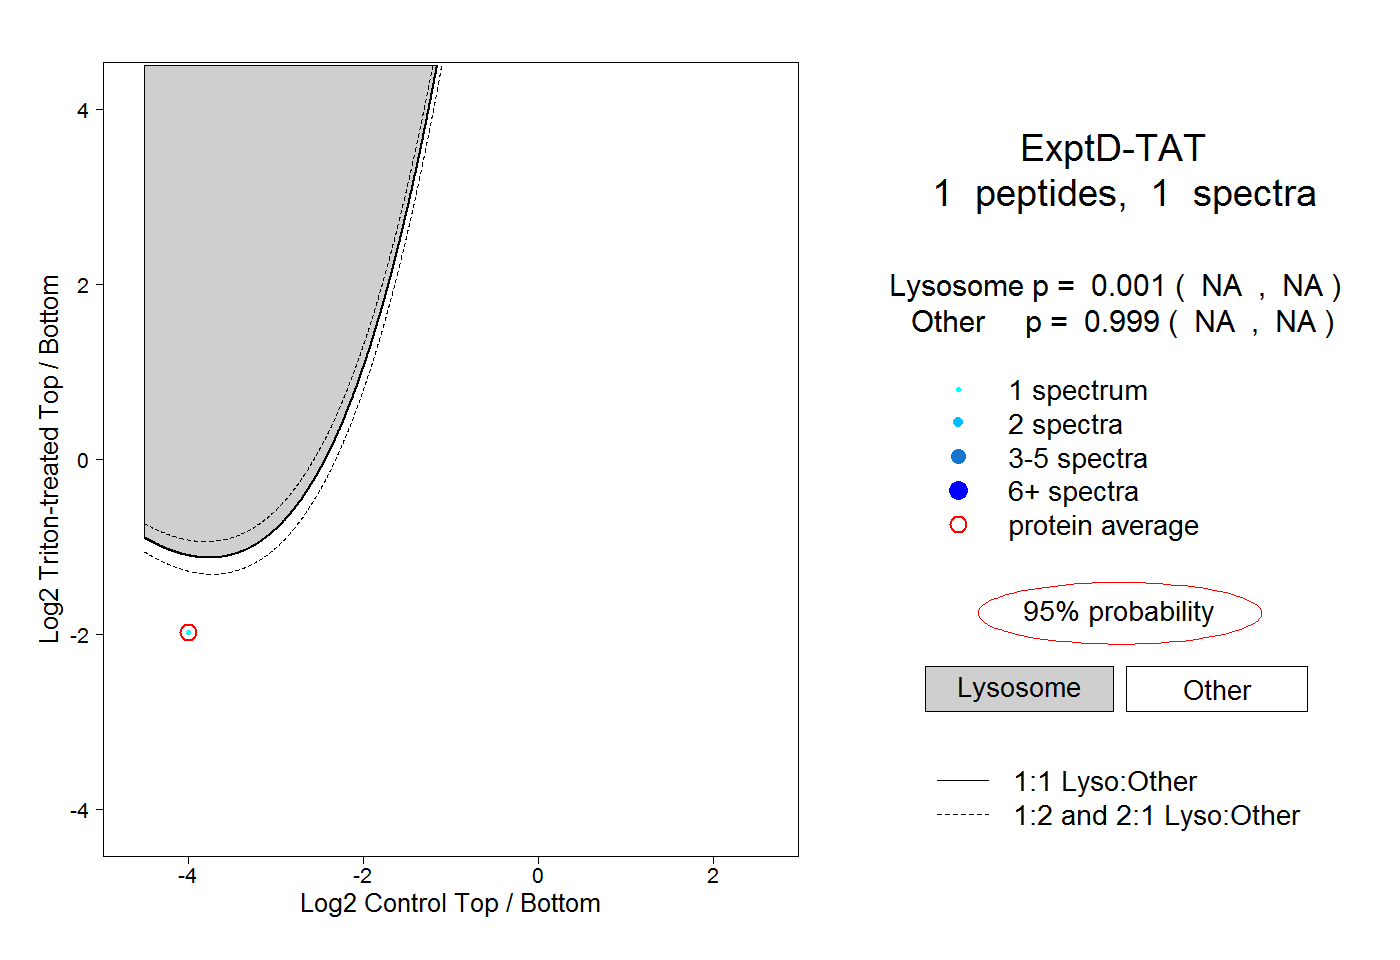 |
0.001 NA | NA |
0.999 NA | NA |