 2
2peptides
spectra
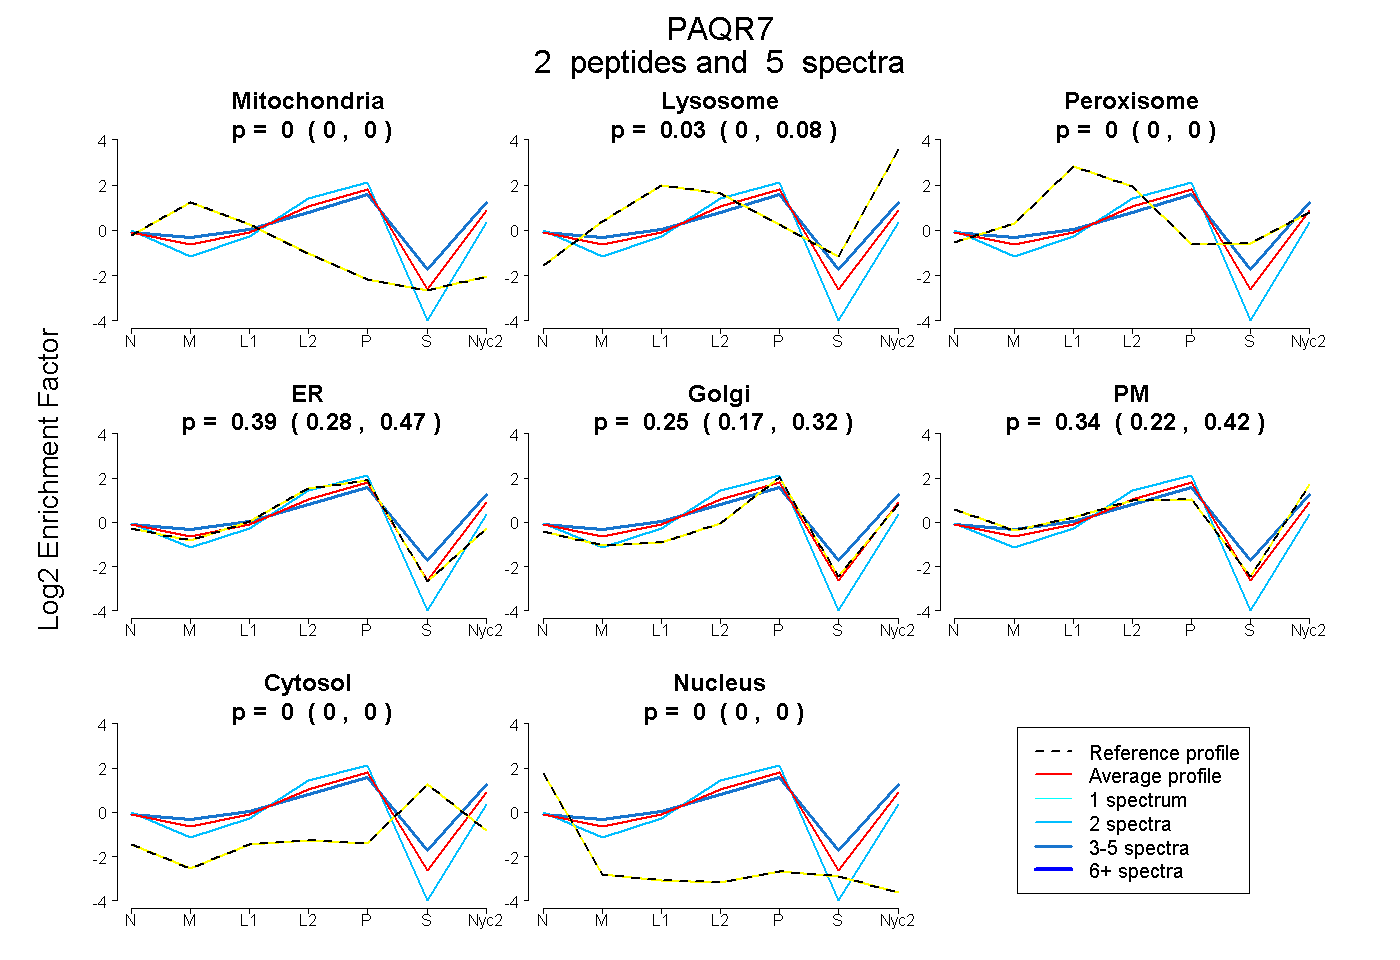
0.000 | 0.000
0.000 | 0.076
0.000 | 0.000
0.281 | 0.471
0.171 | 0.323
0.224 | 0.422
0.000 | 0.000
0.000 | 0.000
| Plot | Mito | Lyso | Perox | ER | Golgi | PM | Cytosol | Nucleus | |||||
| Expt A |
2 peptides |
5 spectra |
|
0.000 0.000 | 0.000 |
0.025 0.000 | 0.076 |
0.000 0.000 | 0.000 |
0.388 0.281 | 0.471 |
0.248 0.171 | 0.323 |
0.338 0.224 | 0.422 |
0.000 0.000 | 0.000 |
0.000 0.000 | 0.000 |
| 3 spectra, GAIYKPLHAR | 0.000 | 0.095 | 0.117 | 0.054 | 0.474 | 0.260 | 0.000 | 0.000 | ||
| 2 spectra, YSQKPGLLGR | 0.000 | 0.000 | 0.000 | 0.765 | 0.163 | 0.072 | 0.000 | 0.000 |
| Plot | Lyso | Other | |||||||||||
| Expt C |
2 peptides |
7 spectra |
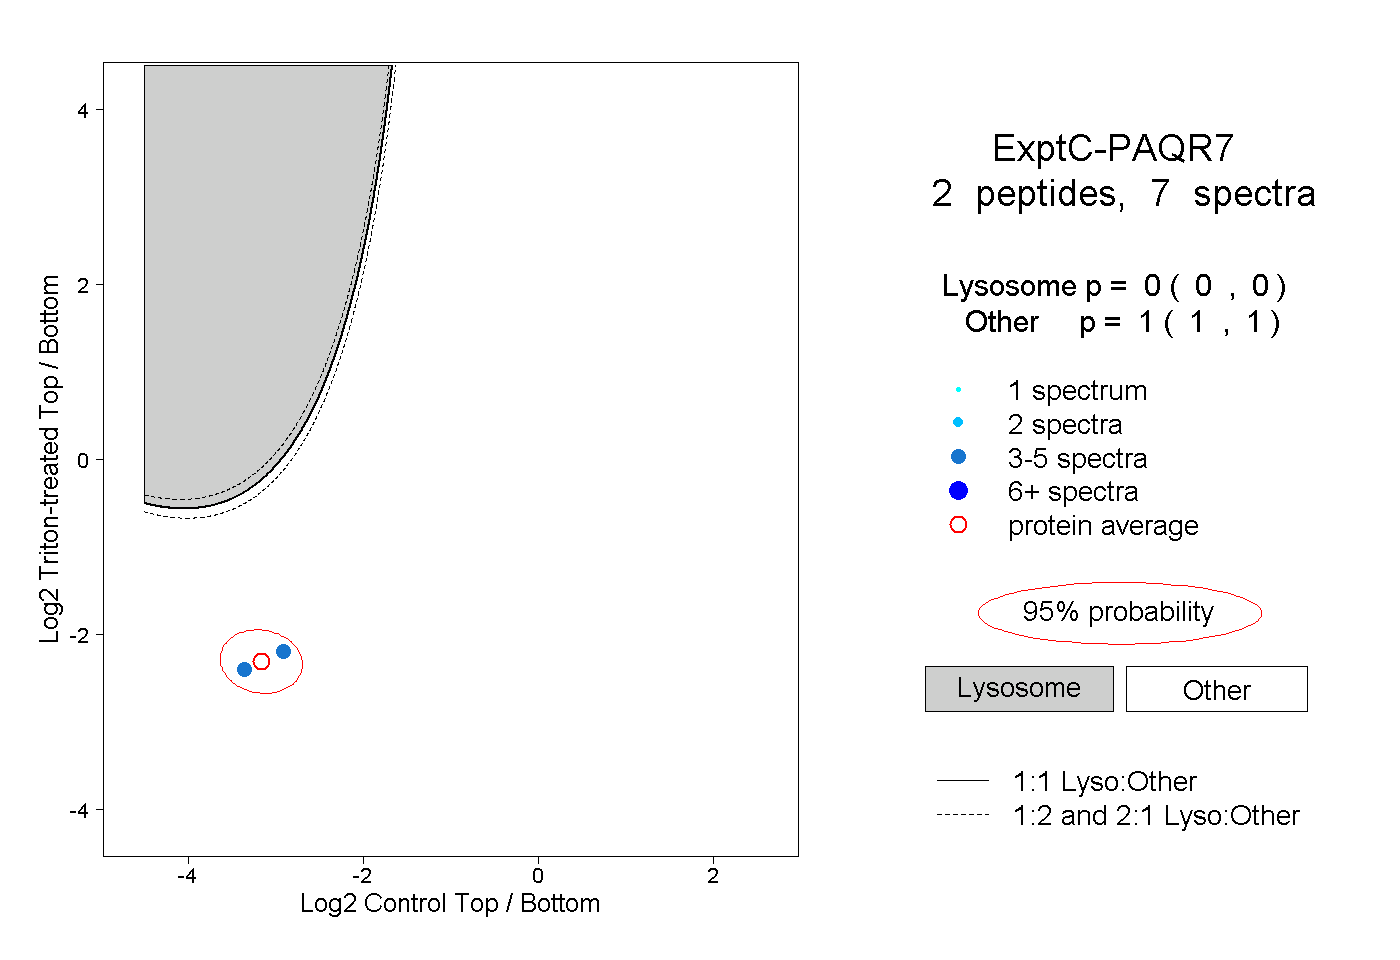 |
0.000 0.000 | 0.000 |
1.000 1.000 | 1.000 |