 1
1peptide
spectra
0.000 | 0.000
0.330 | 0.375
0.000 | 0.000
0.000 | 0.000
0.098 | 0.182
0.000 | 0.035
0.462 | 0.509
0.000 | 0.000
1peptide
spectrum
NA | NA
NA | NA
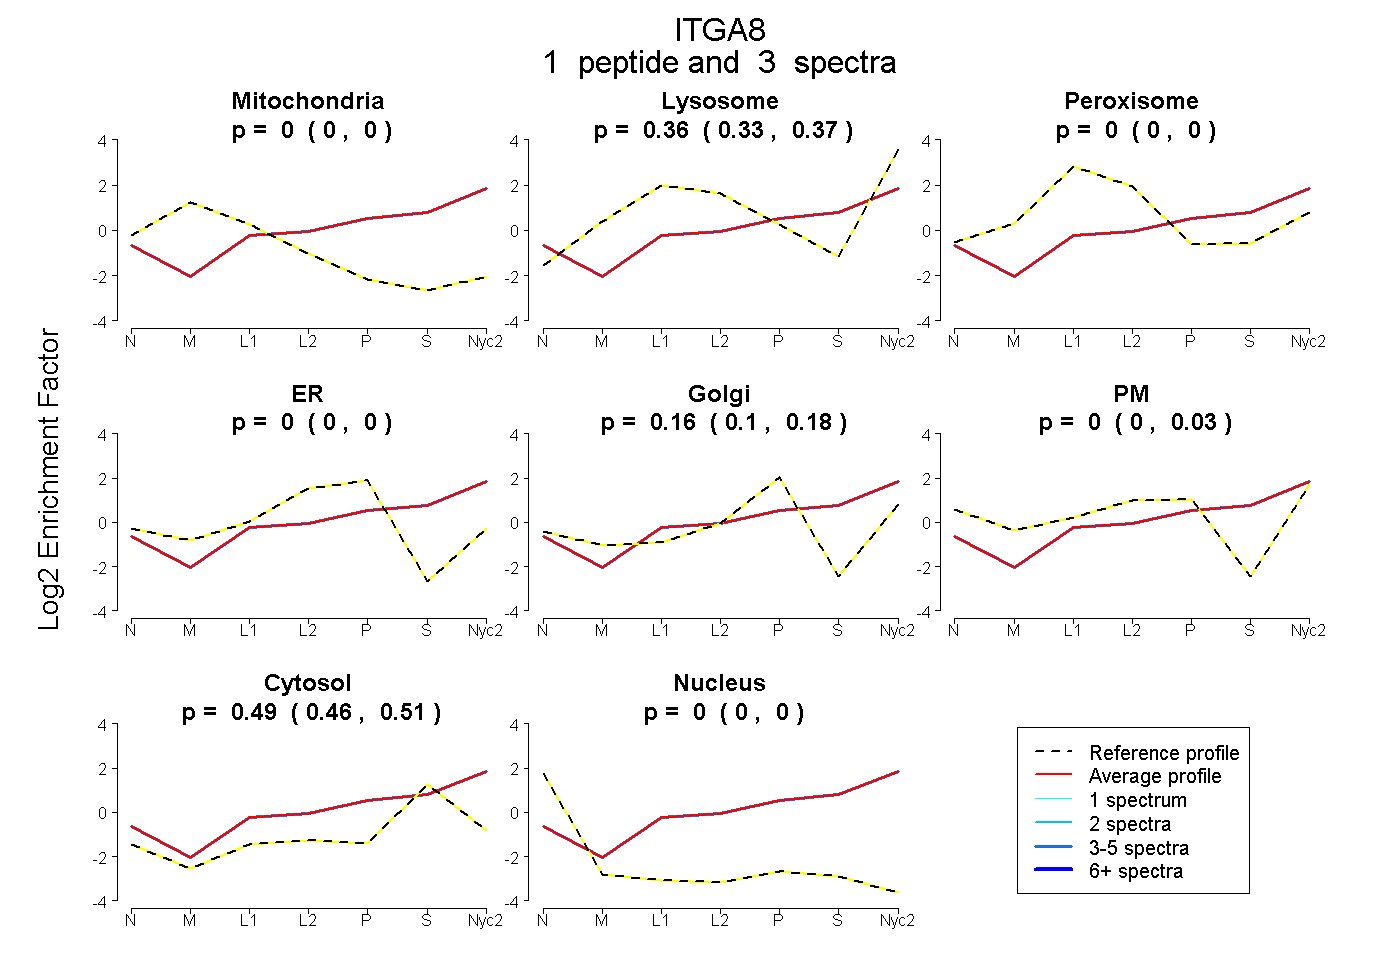
| Plot | Mito | Lyso | Perox | ER | Golgi | PM | Cytosol | Nucleus | |||||
| Expt A |
1 peptide |
3 spectra |
|
0.000 0.000 | 0.000 |
0.357 0.330 | 0.375 |
0.000 0.000 | 0.000 |
0.000 0.000 | 0.000 |
0.157 0.098 | 0.182 |
0.000 0.000 | 0.035 |
0.486 0.462 | 0.509 |
0.000 0.000 | 0.000 |
||
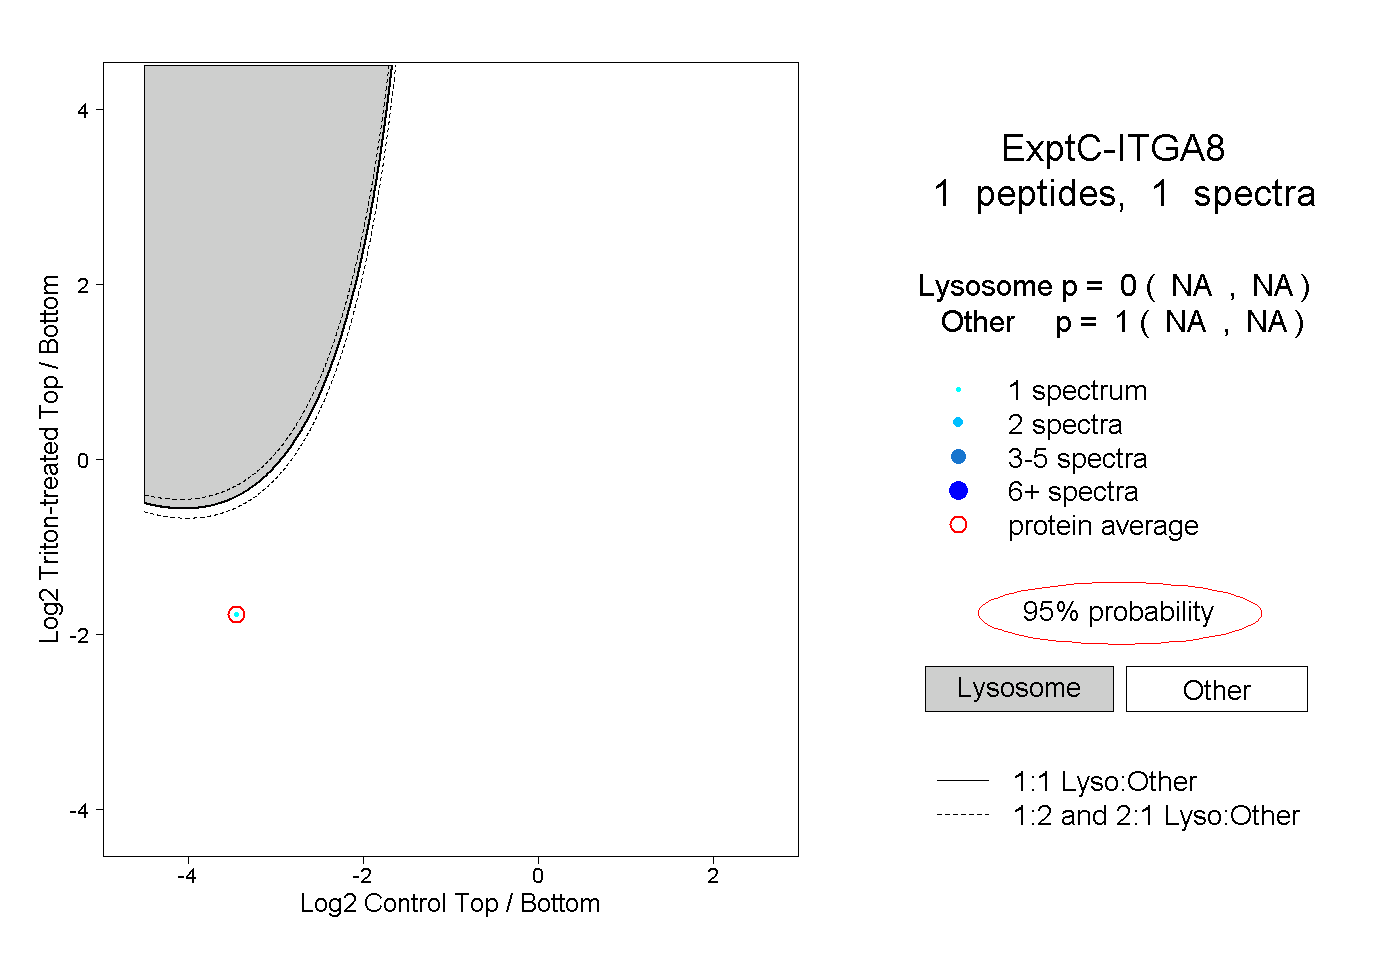
| Plot | Lyso | Other | |||||||||||
| Expt C |
1 peptide |
1 spectrum |
|
0.000 NA | NA |
1.000 NA | NA |