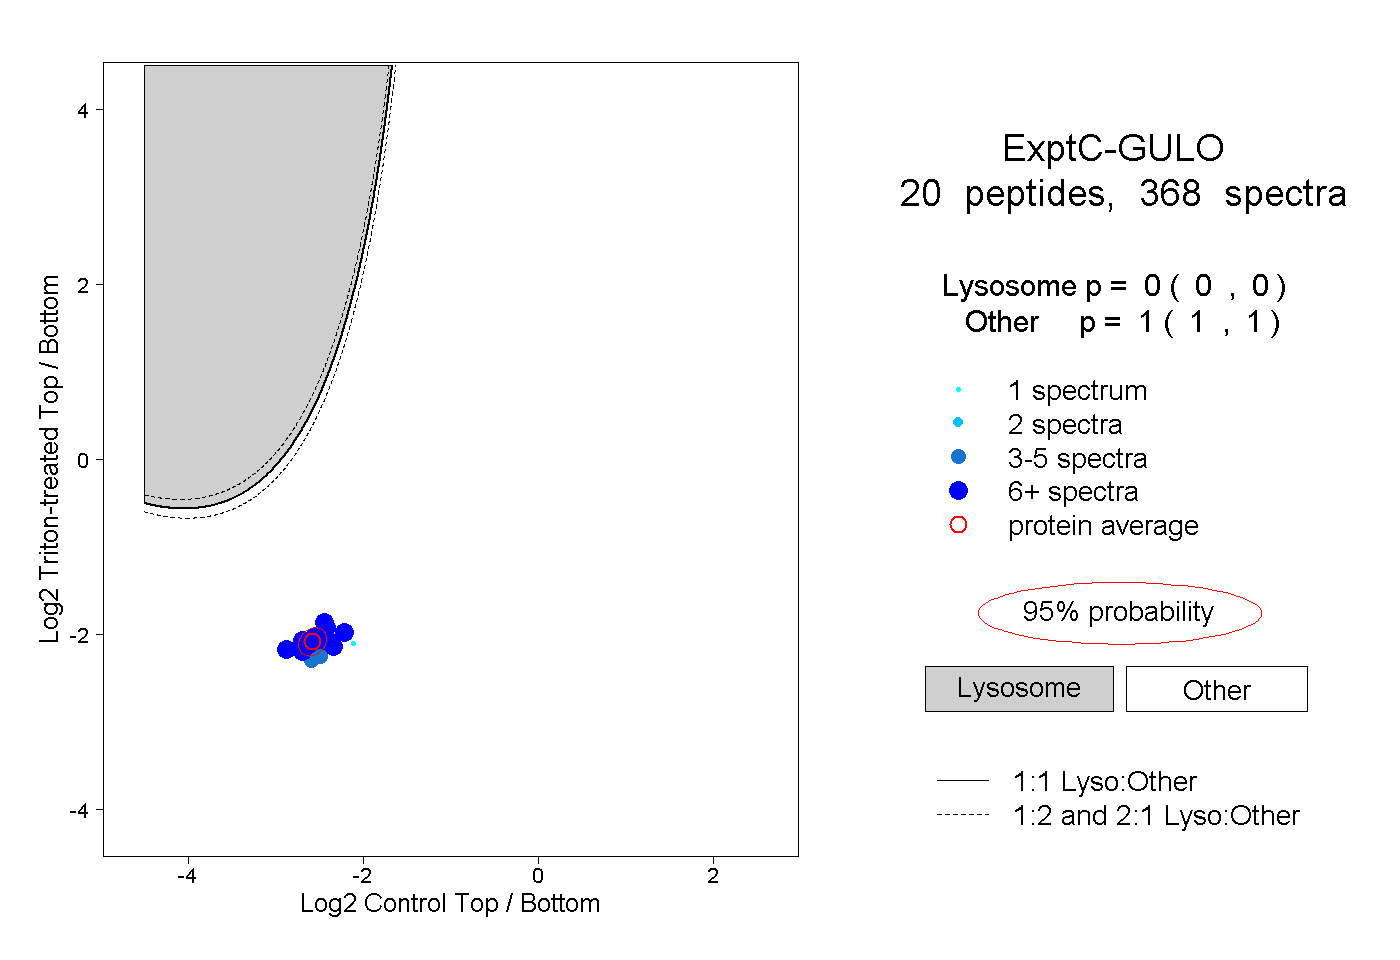
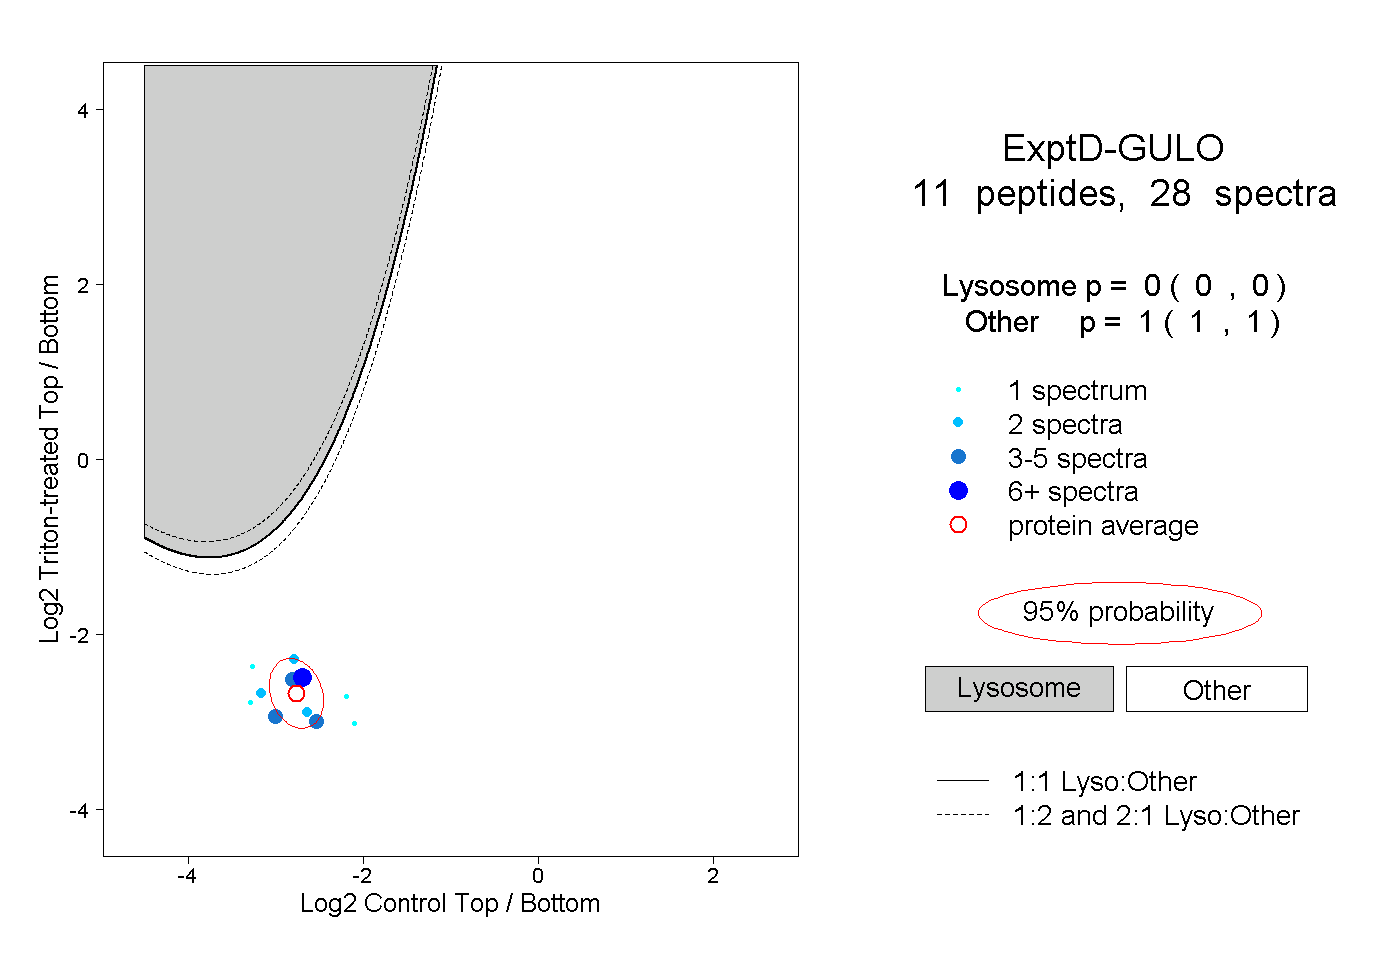
20
20peptides
spectra
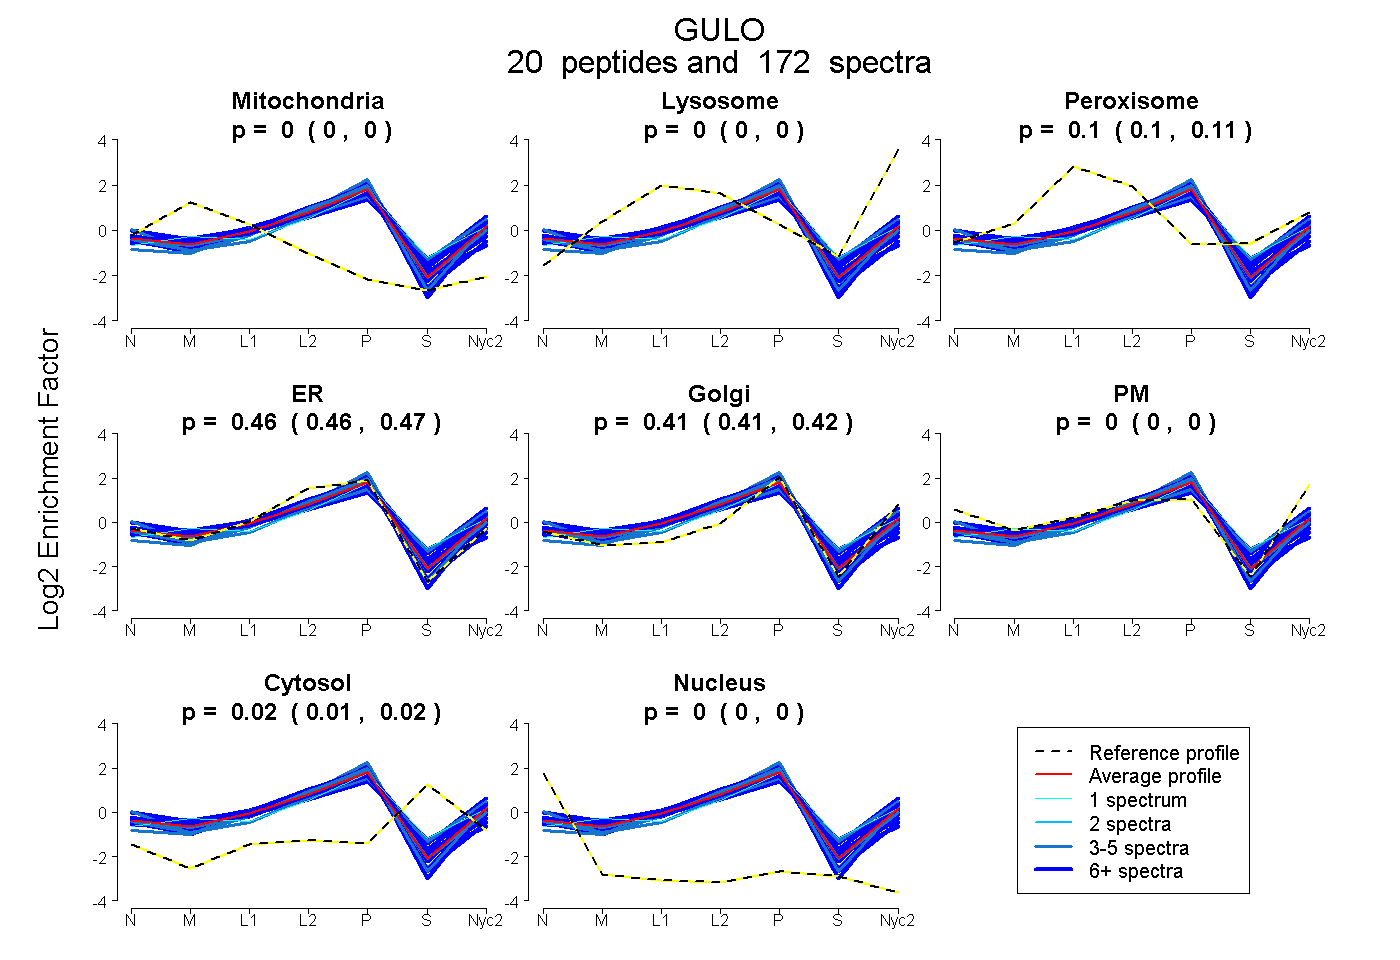
0.000 | 0.002
0.000 | 0.000
0.101 | 0.106
0.458 | 0.469
0.409 | 0.419
0.000 | 0.000
0.015 | 0.019
0.000 | 0.000
17peptides
spectra
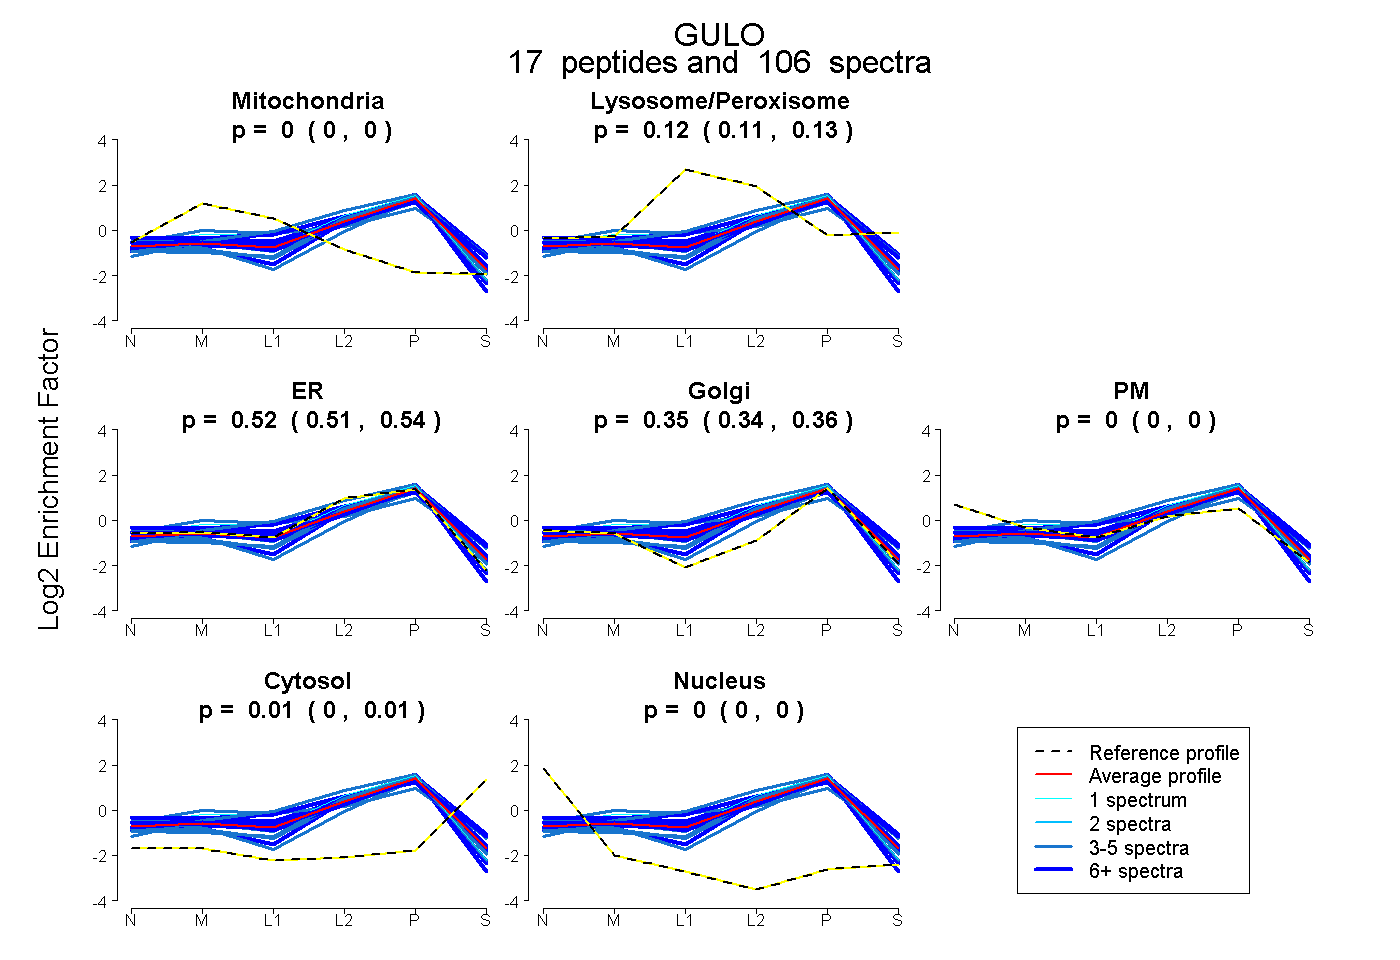
0.000 | 0.000
0.114 | 0.126
0.509 | 0.535
0.340 | 0.360
0.000 | 0.000
0.001 | 0.009
0.000 | 0.000