 3
3peptides
spectra
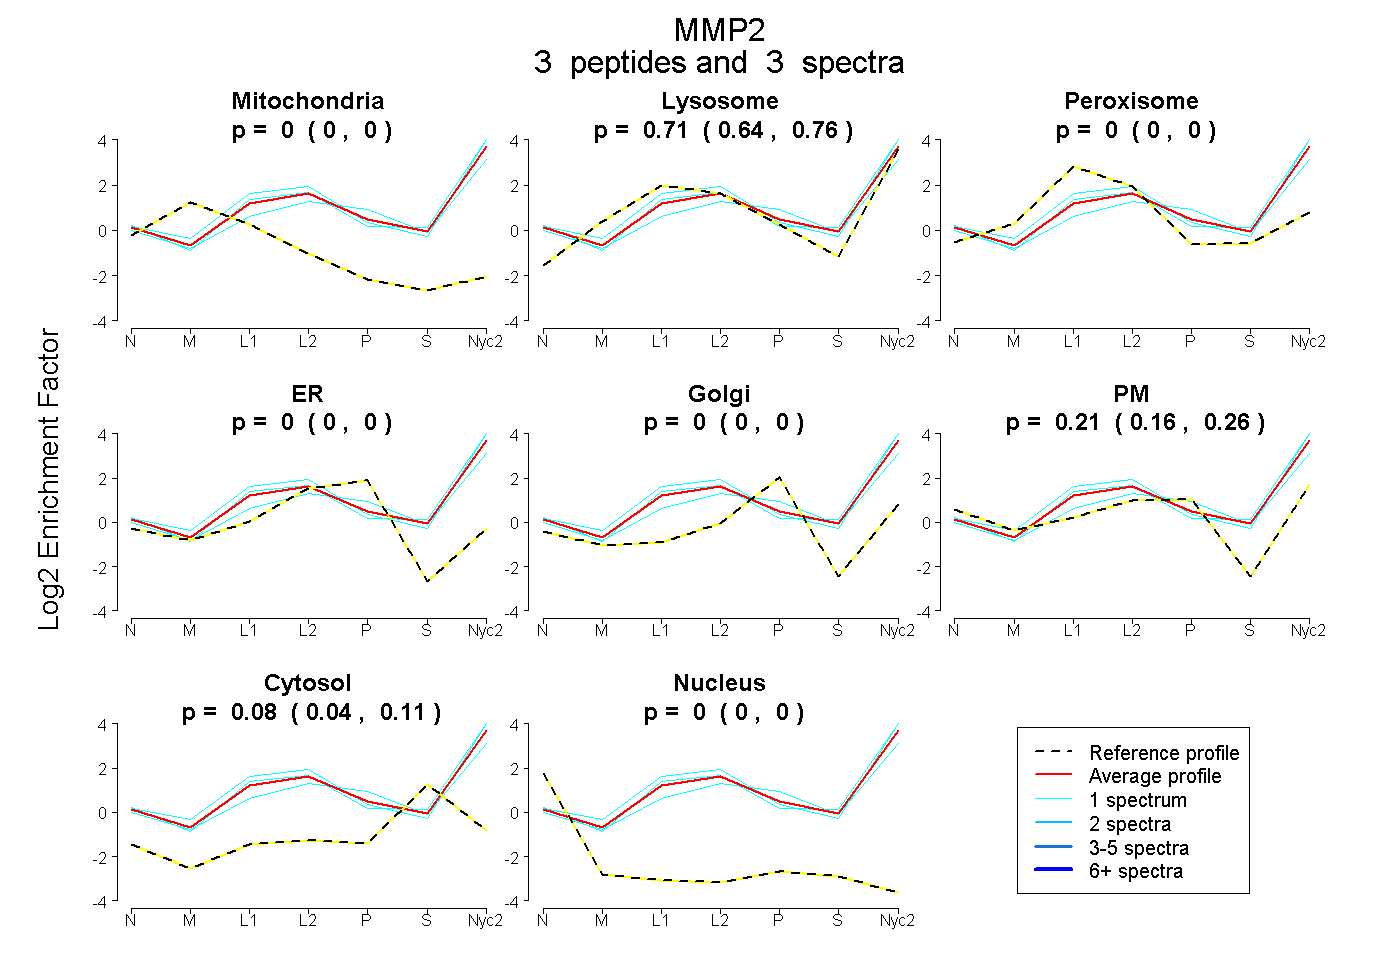
0.000 | 0.000
0.637 | 0.763
0.000 | 0.001
0.000 | 0.000
0.000 | 0.000
0.157 | 0.258
0.043 | 0.107
0.000 | 0.000
9peptides
spectra
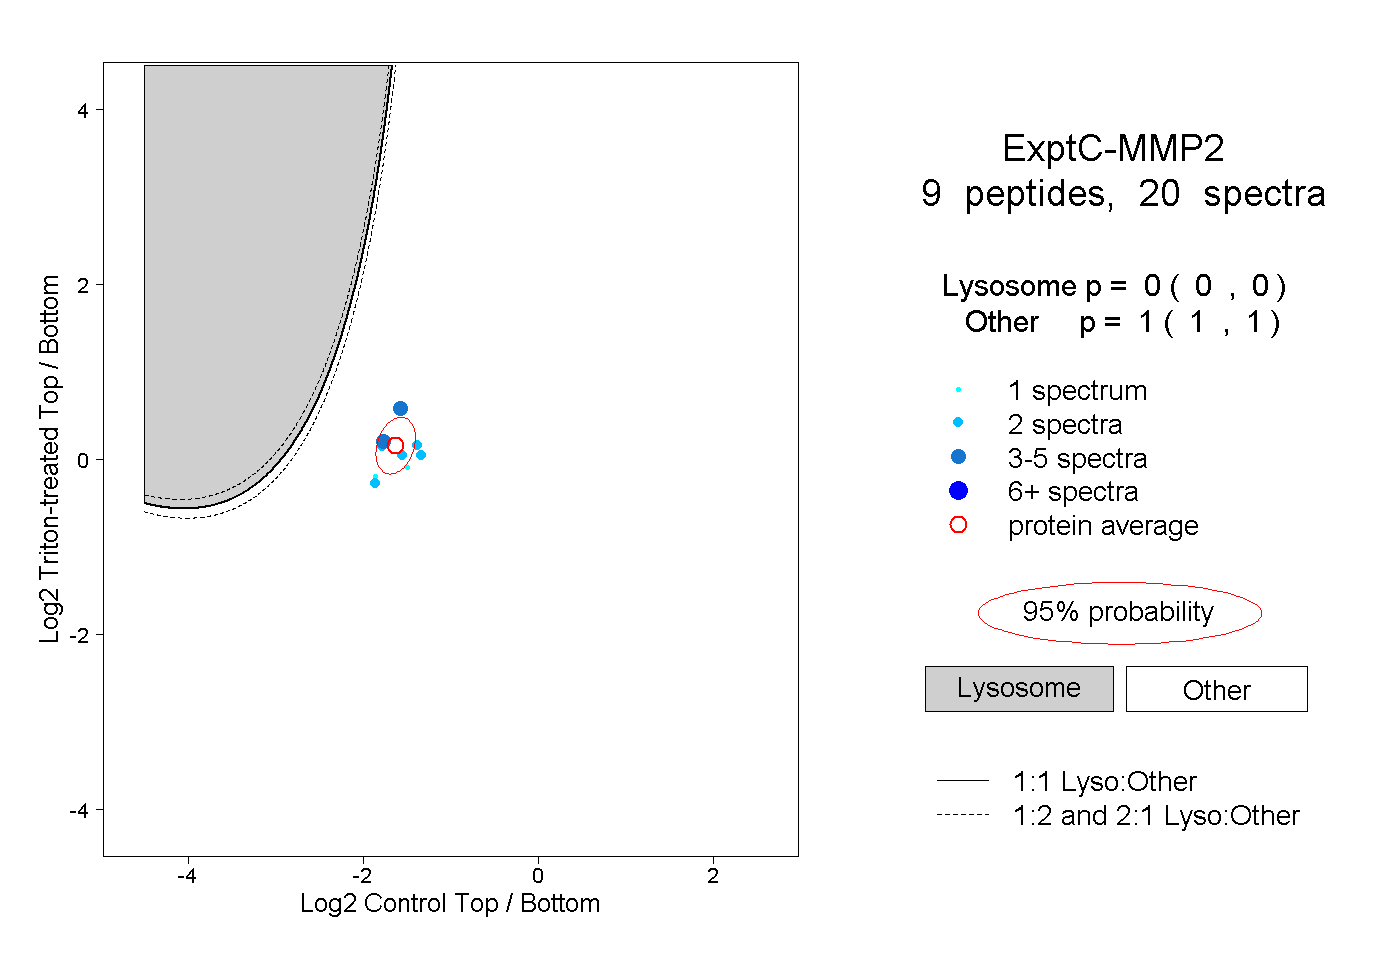
0.000 | 0.000
1.000 | 1.000
1peptide
spectrum
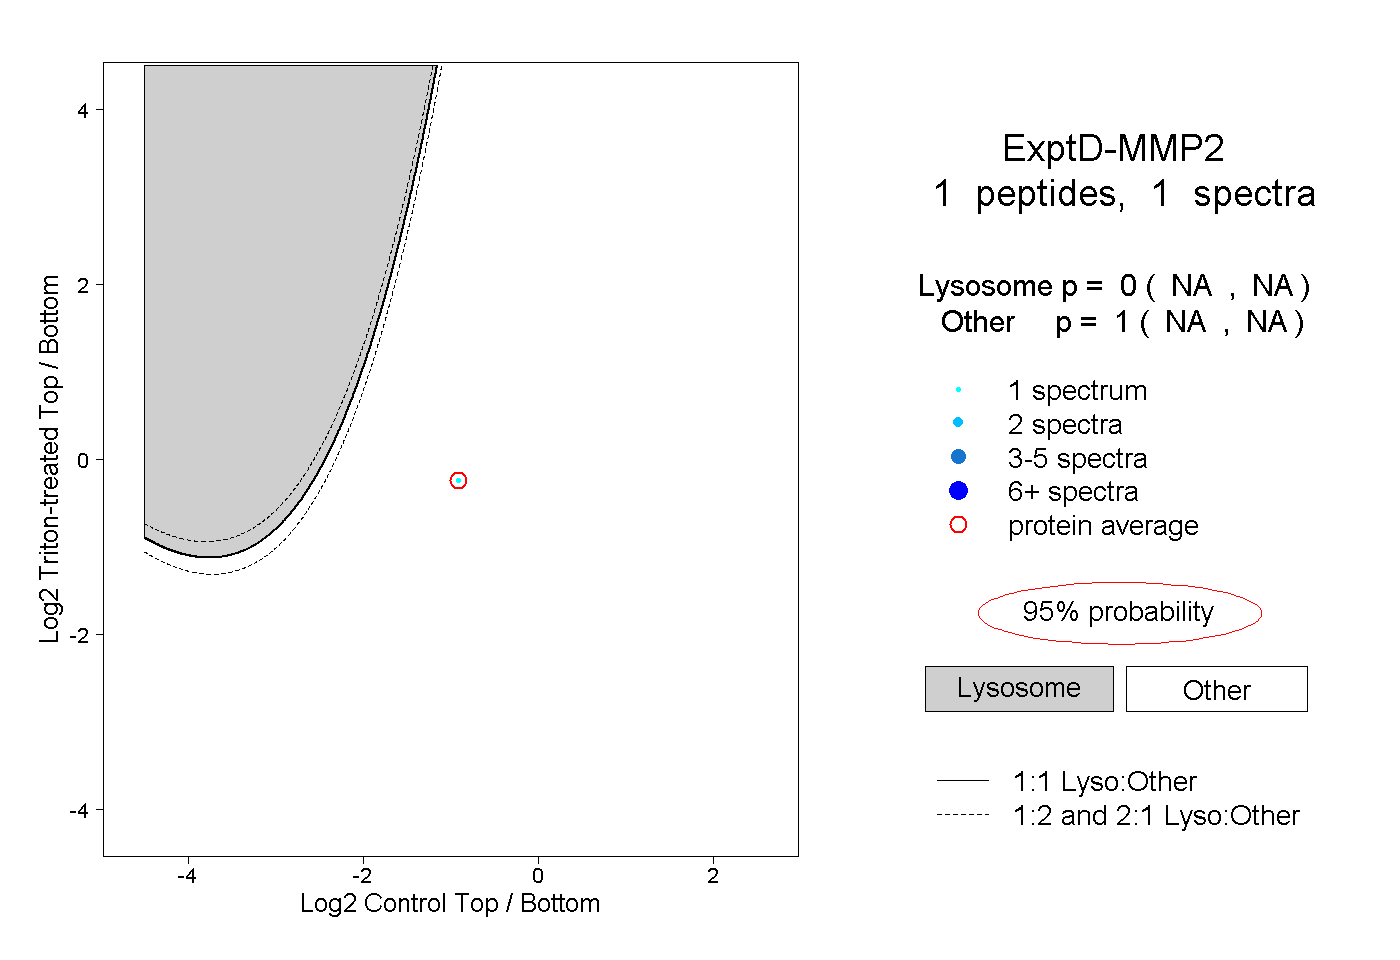
NA | NA
NA | NA