 4
4peptides
spectra
0.000 | 0.046
0.000 | 0.014
0.030 | 0.197
0.000 | 0.080
0.000 | 0.000
0.000 | 0.213
0.650 | 0.739
0.000 | 0.072
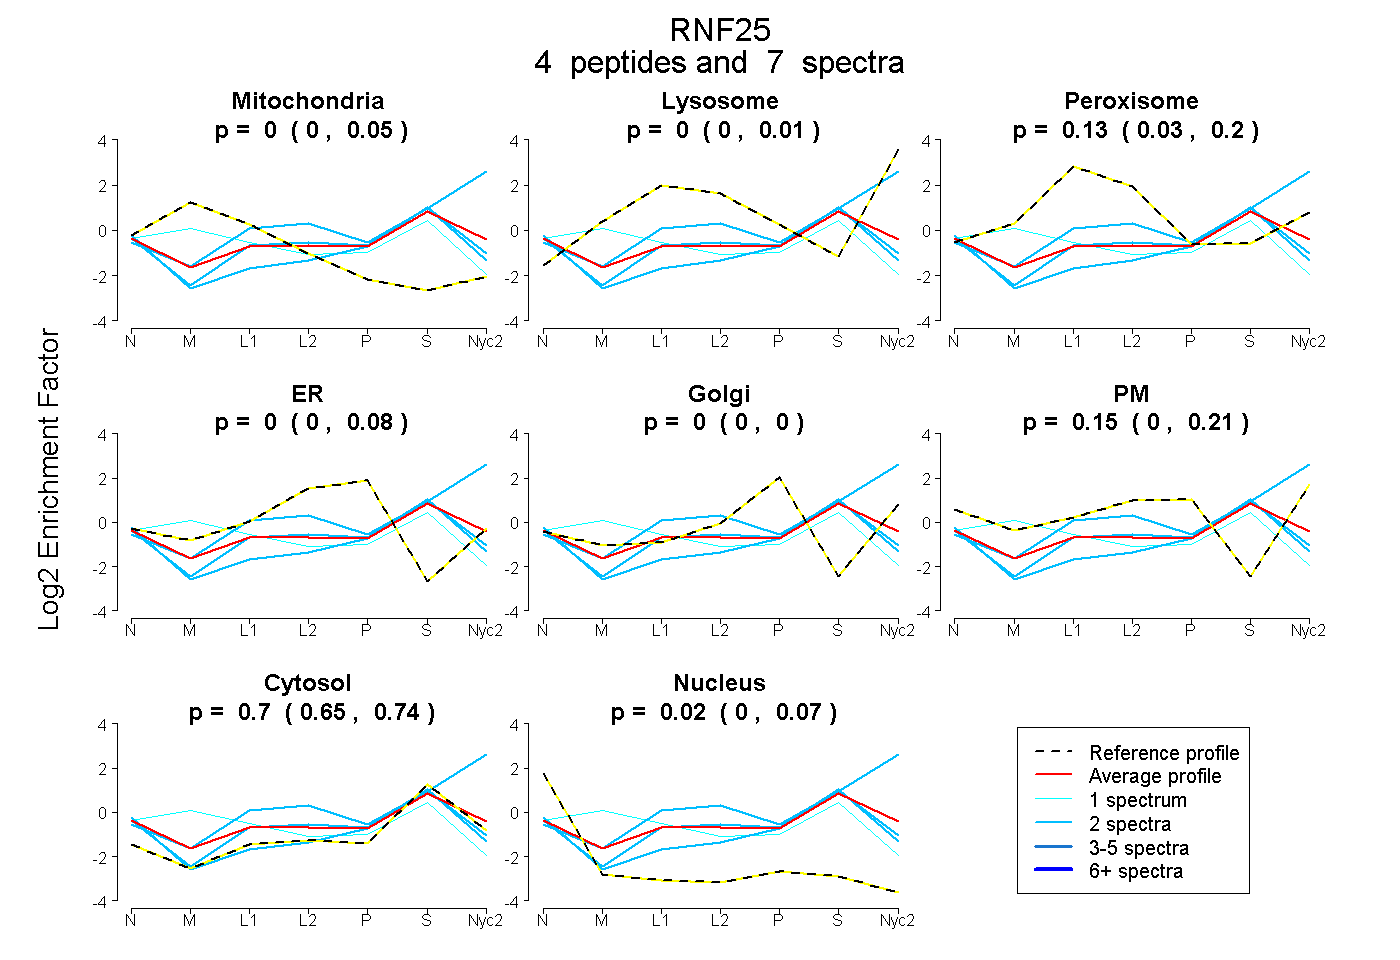
| Plot | Mito | Lyso | Perox | ER | Golgi | PM | Cytosol | Nucleus | |||||
| Expt A |
4 peptides |
7 spectra |
|
0.000 0.000 | 0.046 |
0.000 0.000 | 0.014 |
0.129 0.030 | 0.197 |
0.000 0.000 | 0.080 |
0.000 0.000 | 0.000 |
0.146 0.000 | 0.213 |
0.703 0.650 | 0.739 |
0.023 0.000 | 0.072 |
| 1 spectrum, AVGVQCPVCR | 0.435 | 0.000 | 0.051 | 0.000 | 0.000 | 0.000 | 0.513 | 0.000 | ||
| 2 spectra, GGIIDLEAER | 0.000 | 0.000 | 0.000 | 0.000 | 0.090 | 0.006 | 0.798 | 0.106 | ||
| 2 spectra, EPLVYDLASLK | 0.000 | 0.000 | 0.101 | 0.098 | 0.000 | 0.000 | 0.741 | 0.060 | ||
| 2 spectra, GLSDEQIHK | 0.000 | 0.525 | 0.000 | 0.000 | 0.000 | 0.000 | 0.475 | 0.000 |
| Plot | Lyso | Other | |||||||||||
| Expt C |
1 peptide |
2 spectra |
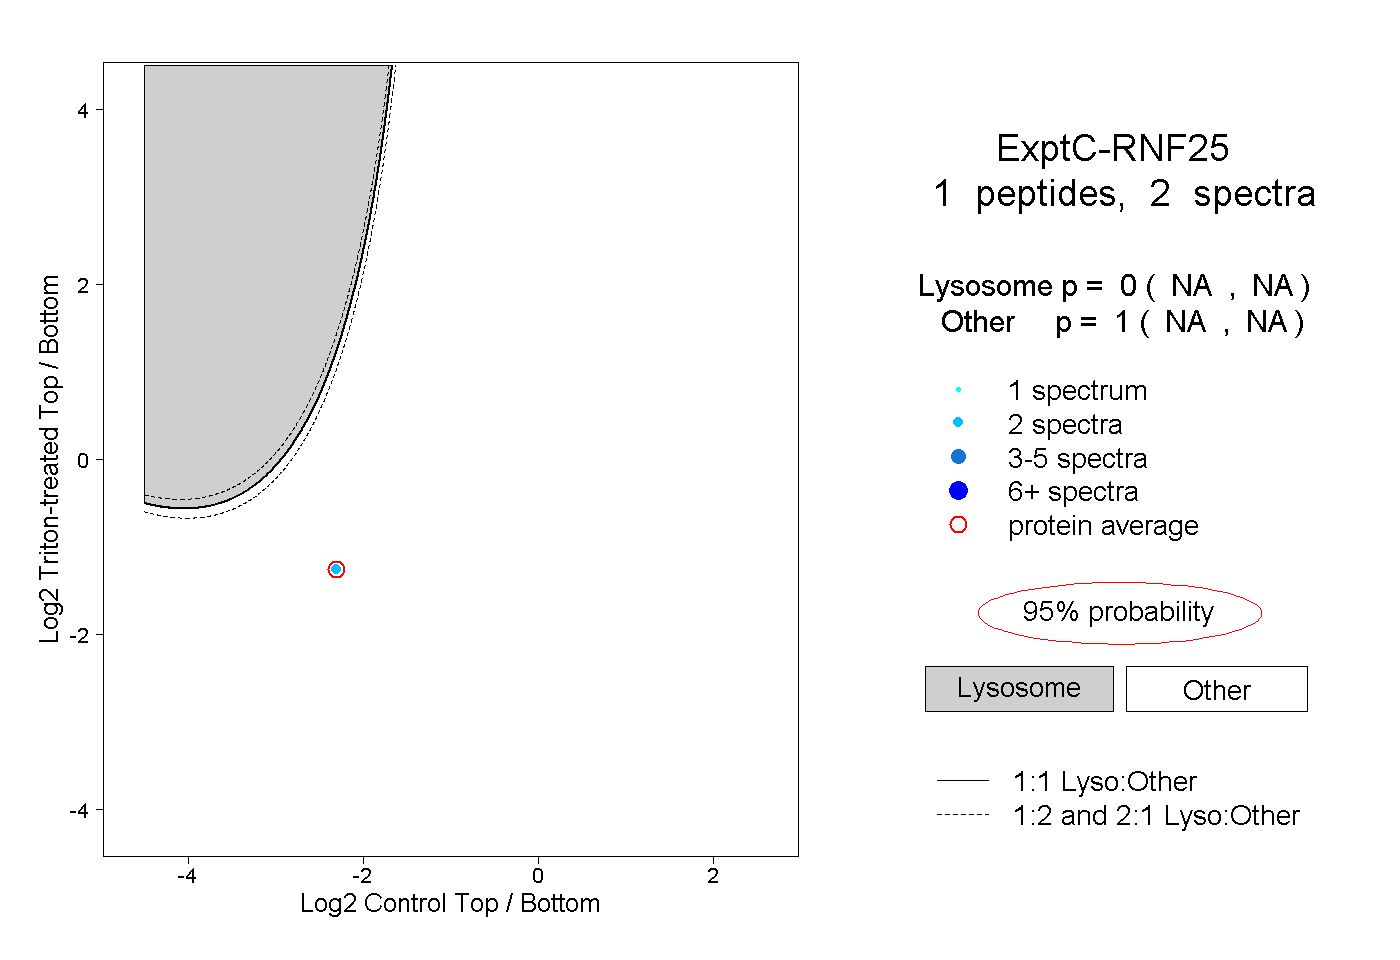 |
0.000 NA | NA |
1.000 NA | NA |