 6
6peptides
spectra
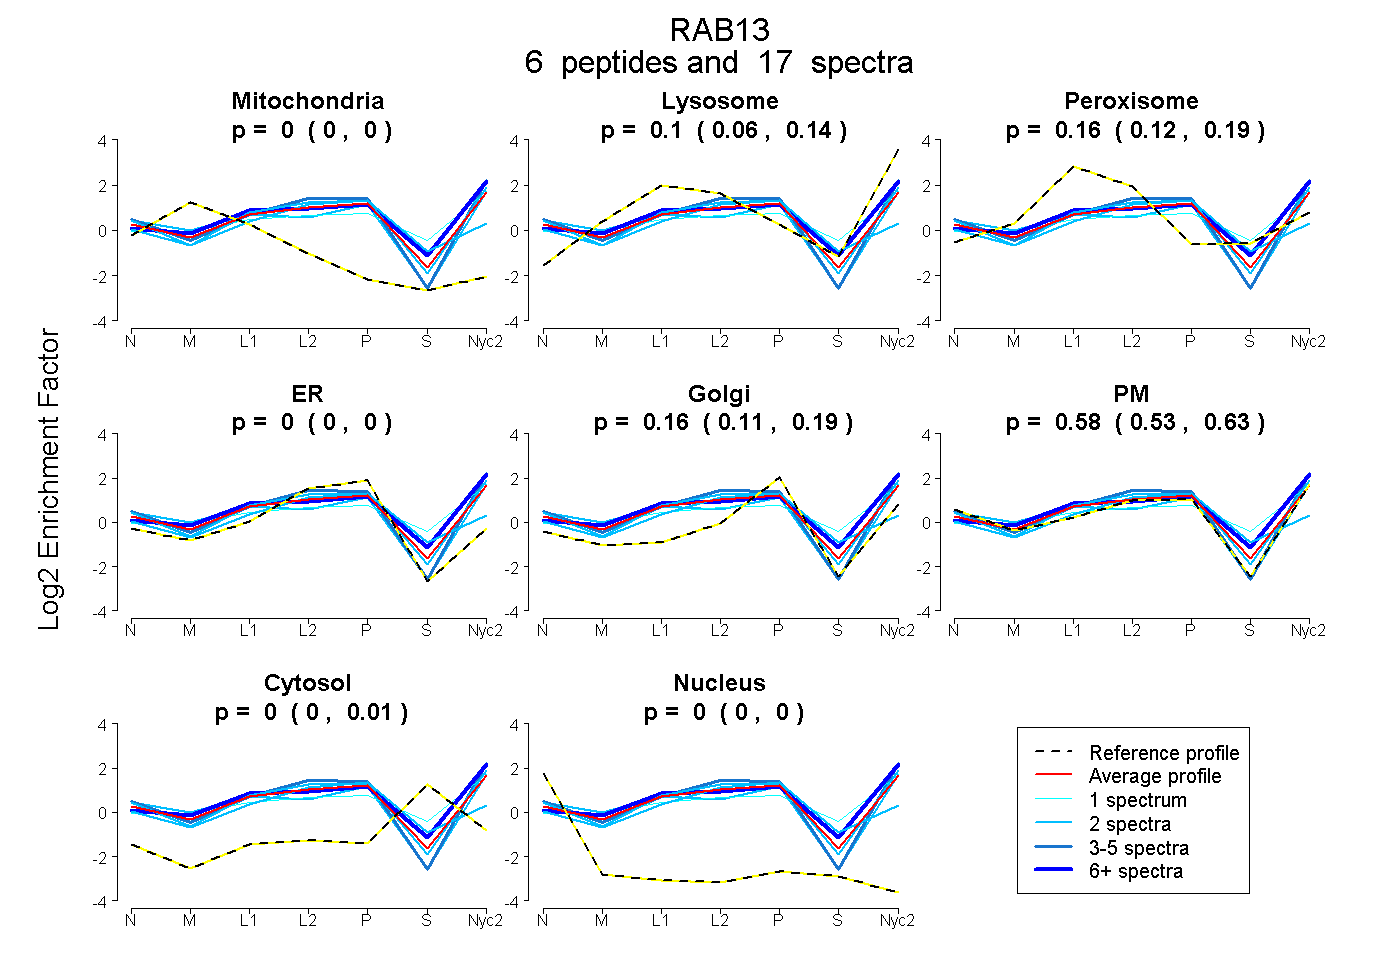
0.000 | 0.000
0.059 | 0.136
0.118 | 0.195
0.000 | 0.000
0.115 | 0.187
0.526 | 0.628
0.000 | 0.011
0.000 | 0.000
2peptides
spectra
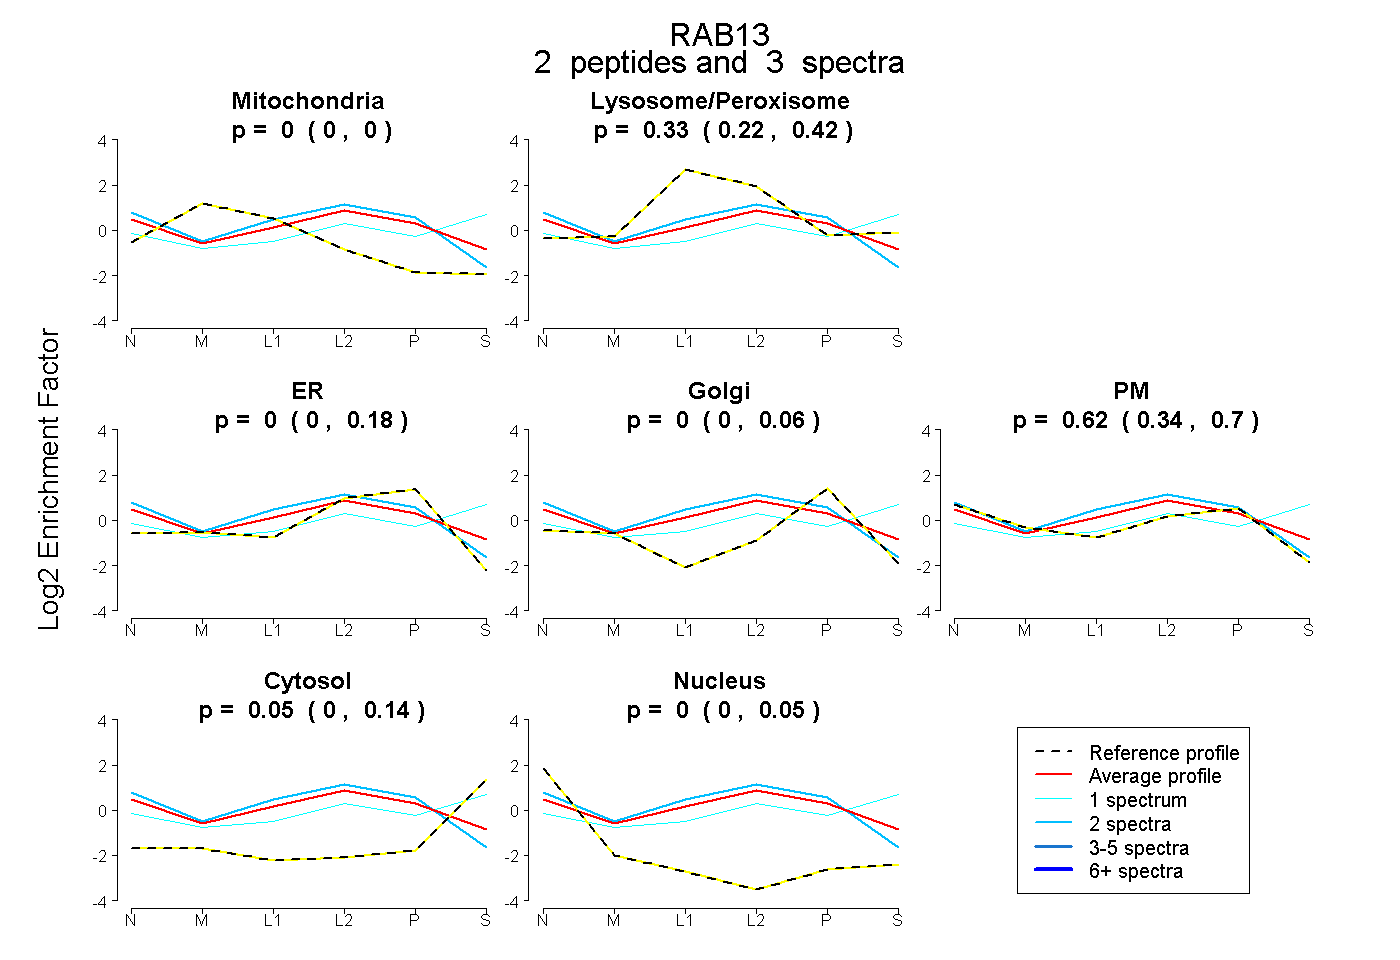
0.000 | 0.000
0.225 | 0.423
0.000 | 0.184
0.000 | 0.063
0.343 | 0.697
0.000 | 0.138
0.000 | 0.054
7peptides
spectra
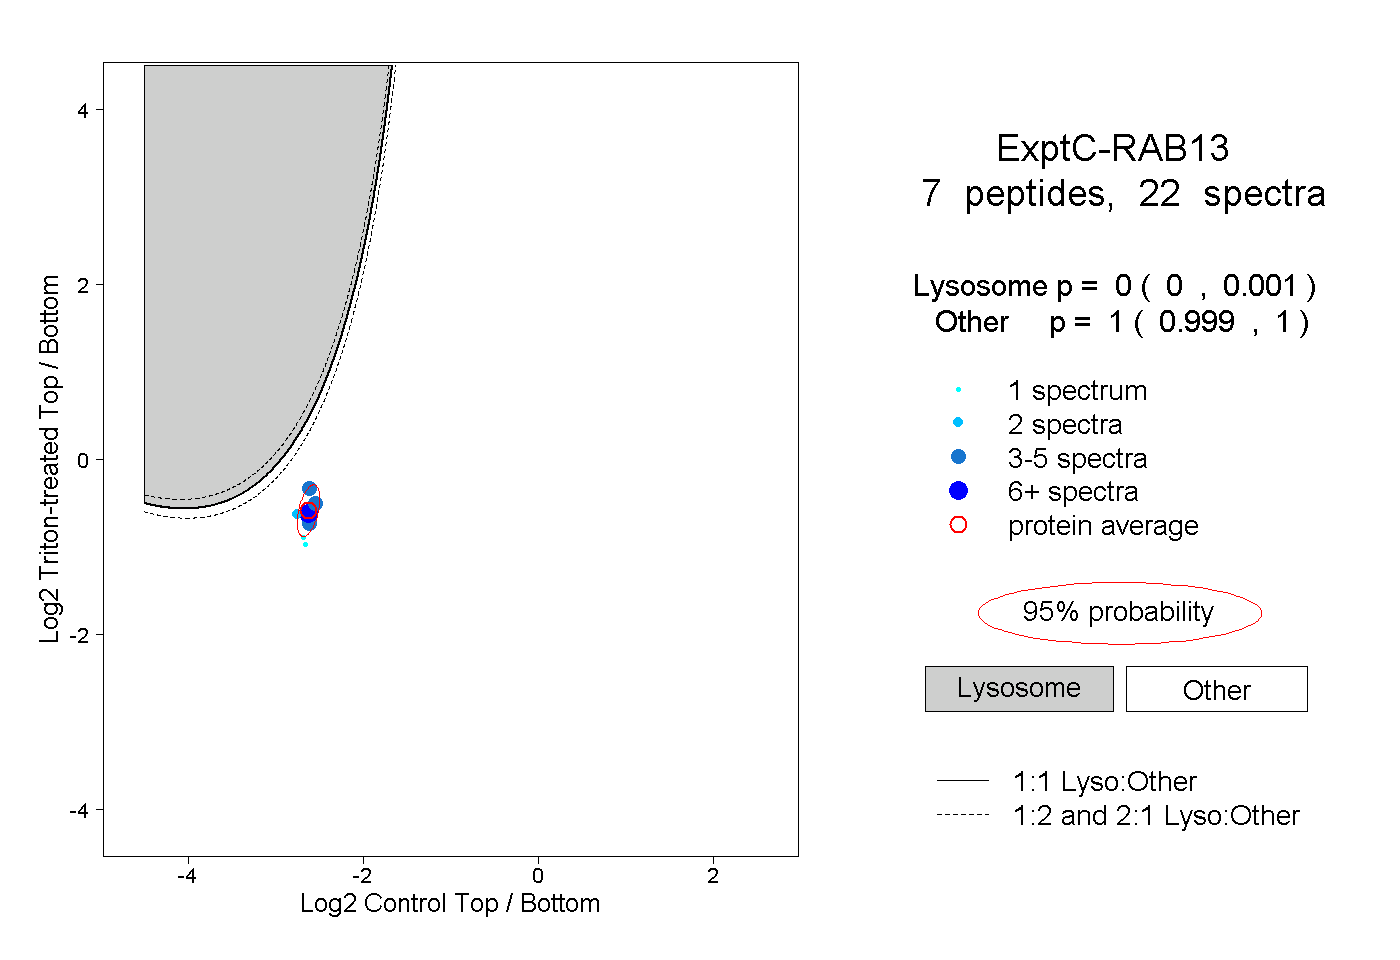
0.000 | 0.001
0.999 | 1.000
3peptides
spectra
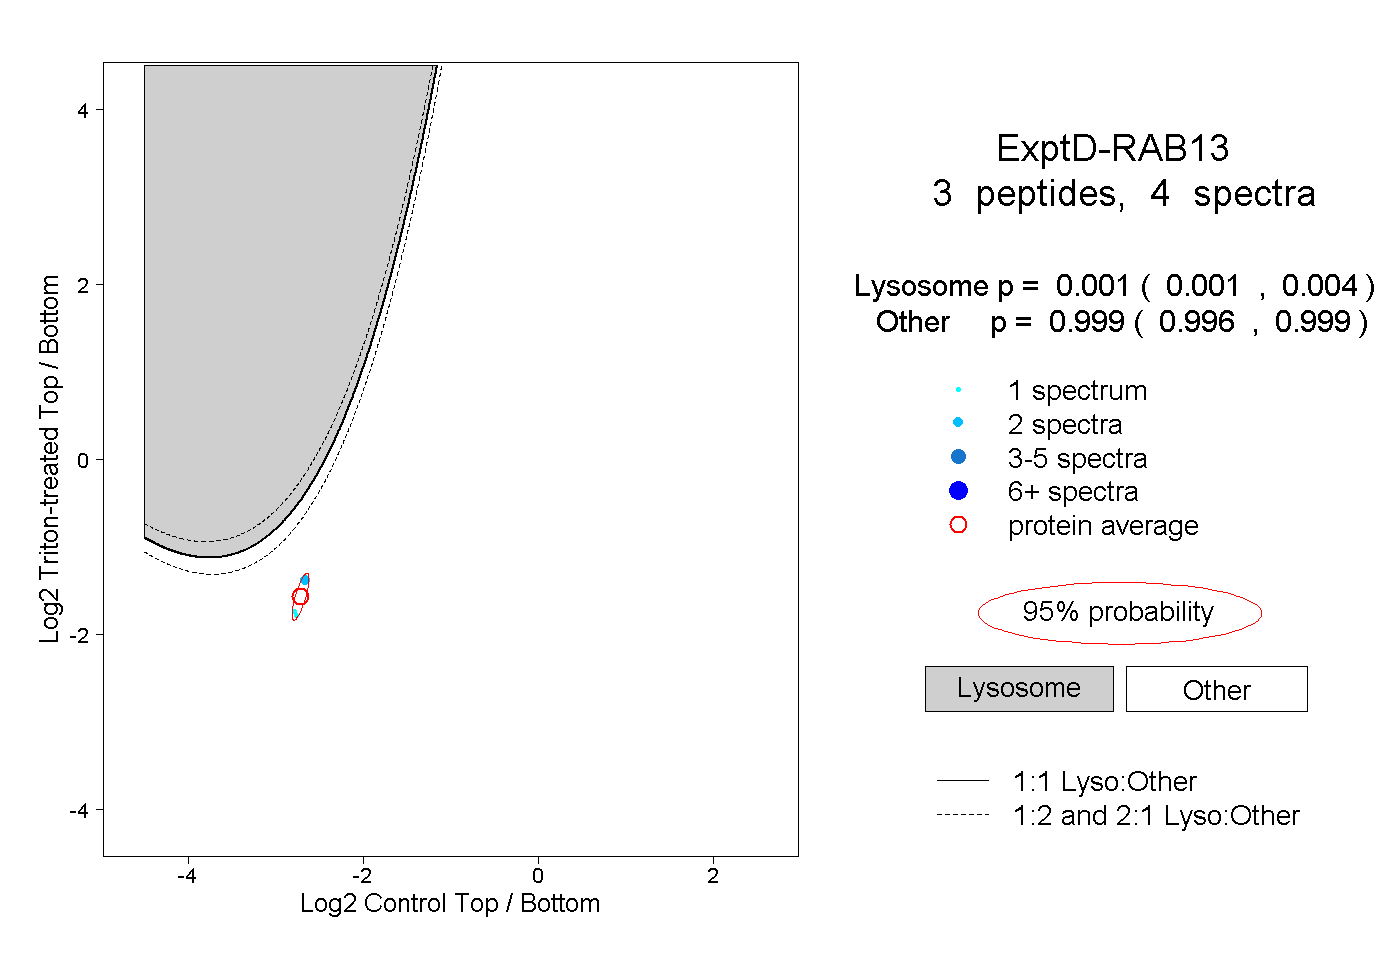
0.001 | 0.004
0.996 | 0.999