 5
5peptides
spectra
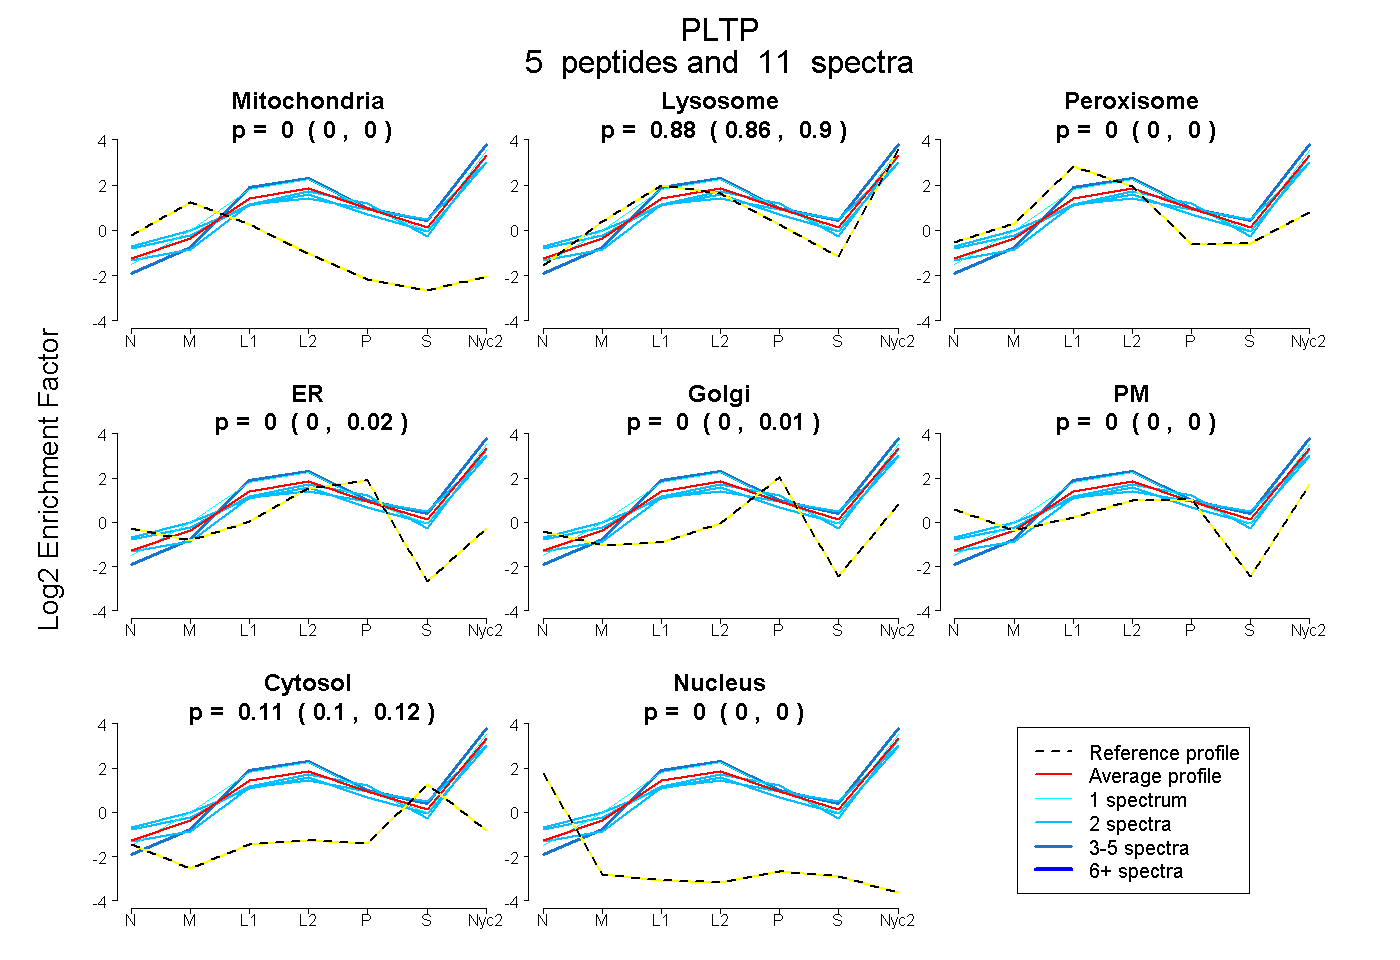
0.000 | 0.000
0.865 | 0.895
0.000 | 0.000
0.000 | 0.017
0.000 | 0.013
0.000 | 0.000
0.099 | 0.124
0.000 | 0.000
6peptides
spectra
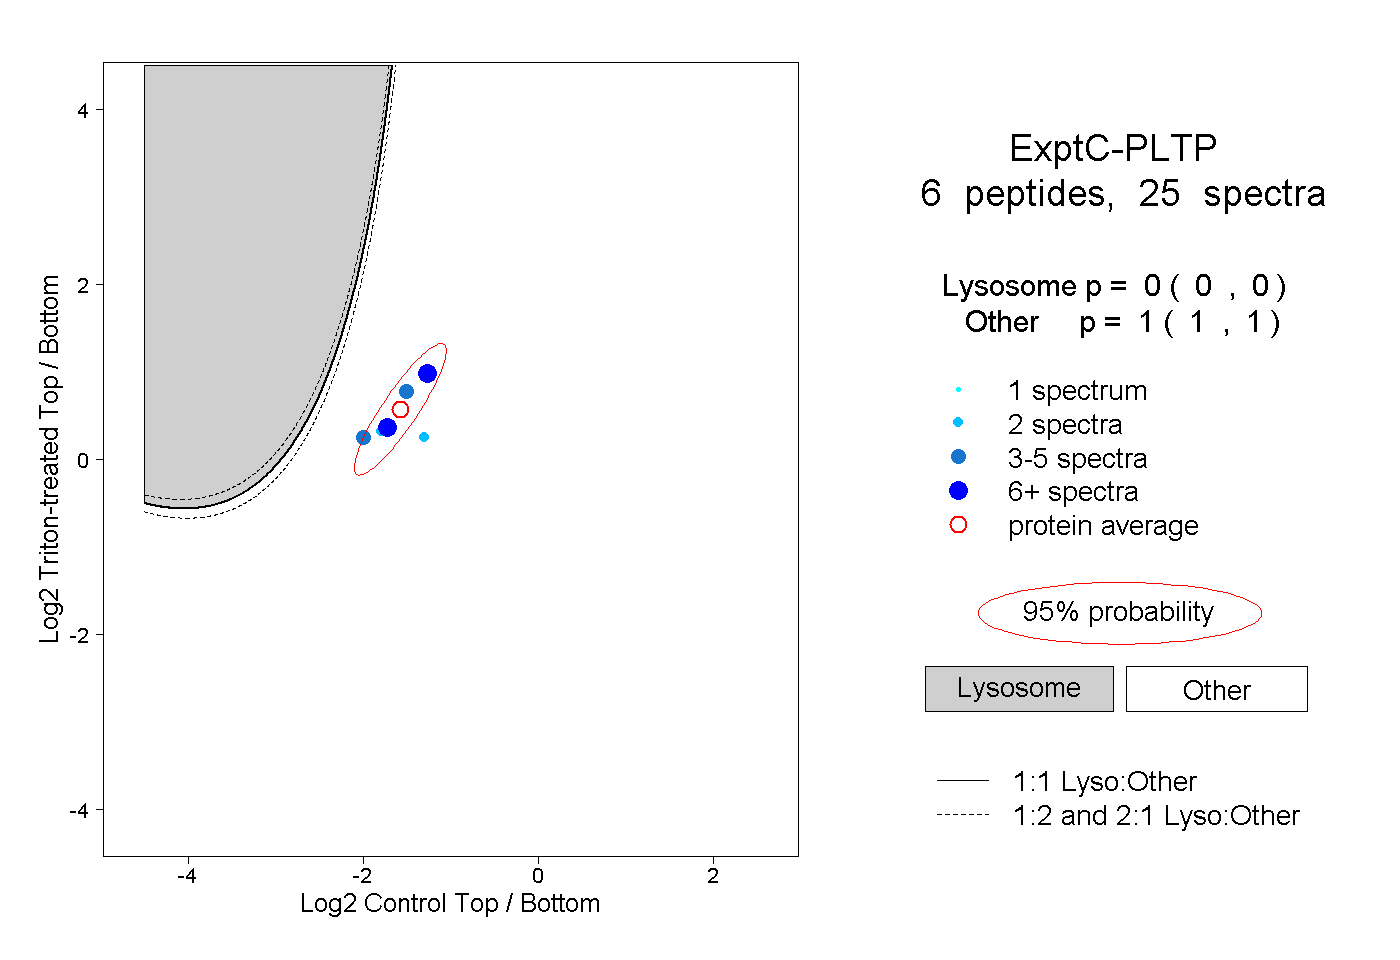
0.000 | 0.000
1.000 | 1.000
4peptides
spectra
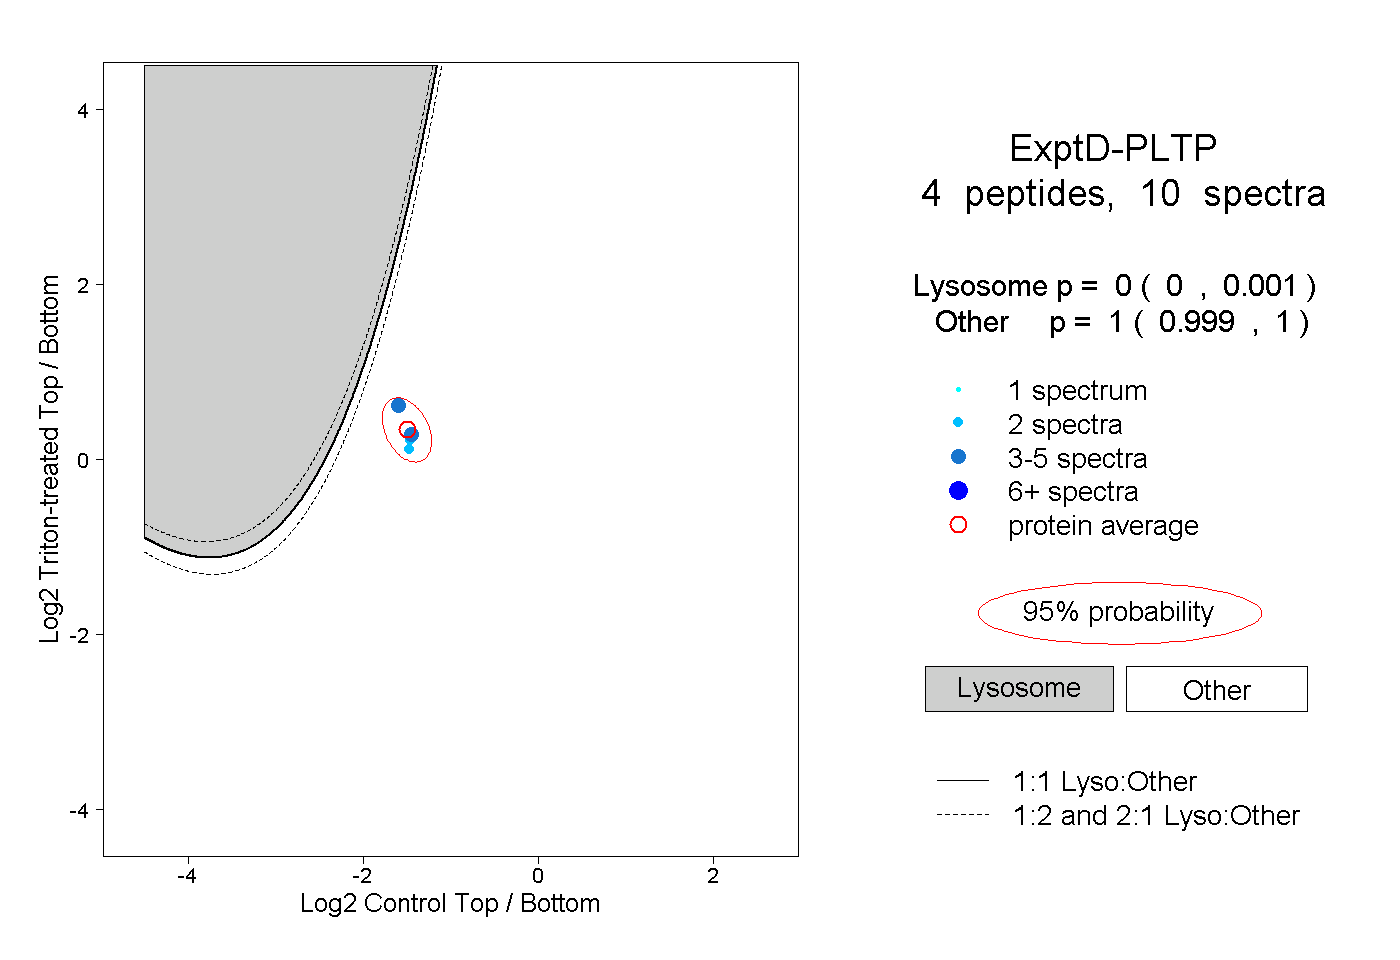
0.000 | 0.001
0.999 | 1.000