| 2 spectra, HLLLDEDPLSR |
0.000 |
|
0.886 |
|
0.114 |
0.000 |
0.000 |
0.000 |
0.000 |
|
| 6 spectra, VPPLPSGR |
0.000 |
|
0.847 |
|
0.153 |
0.000 |
0.000 |
0.000 |
0.000 |
|
| 2 spectra, WDLSAR |
0.031 |
|
0.817 |
|
0.044 |
0.109 |
0.000 |
0.000 |
0.000 |
|
| 2 spectra, VLSAITR |
0.000 |
|
0.715 |
|
0.285 |
0.000 |
0.000 |
0.000 |
0.000 |
|
| 1 spectrum, LAVTELQGR |
0.000 |
|
0.837 |
|
0.163 |
0.000 |
0.000 |
0.000 |
0.000 |
|
| 6 spectra, VLALSPGAR |
0.000 |
|
0.790 |
|
0.210 |
0.000 |
0.000 |
0.000 |
0.000 |
|
| 1 spectrum, LQPSVSEQELLR |
0.000 |
|
0.648 |
|
0.352 |
0.000 |
0.000 |
0.000 |
0.000 |
|
| 4 spectra, LGLHLLK |
0.000 |
|
0.867 |
|
0.133 |
0.000 |
0.000 |
0.000 |
0.000 |
|
| 6 spectra, VLETRPALQGLLGPGTR |
0.000 |
|
0.769 |
|
0.231 |
0.000 |
0.000 |
0.000 |
0.000 |
|
| 4 spectra, LVFVGASEDR |
0.000 |
|
0.878 |
|
0.122 |
0.000 |
0.000 |
0.000 |
0.000 |
|
| 2 spectra, TTAVTAACSR |
0.000 |
|
0.893 |
|
0.107 |
0.000 |
0.000 |
0.000 |
0.000 |
|
| 4 spectra, VQDLPTDVR |
0.000 |
|
0.904 |
|
0.096 |
0.000 |
0.000 |
0.000 |
0.000 |
|
| 4 spectra, DLEEGLEPR |
0.000 |
|
0.796 |
|
0.204 |
0.000 |
0.000 |
0.000 |
0.000 |
|
| 1 spectrum, SGLLLHGPPGTGK |
0.000 |
|
0.645 |
|
0.009 |
0.023 |
0.252 |
0.070 |
0.000 |
|
| 2 spectra, LQTTFSR |
0.000 |
|
0.895 |
|
0.105 |
0.000 |
0.000 |
0.000 |
0.000 |
|
| 1 spectrum, TAFPHELEVPVLSESQR |
0.135 |
|
0.706 |
|
0.009 |
0.151 |
0.000 |
0.000 |
0.000 |
|
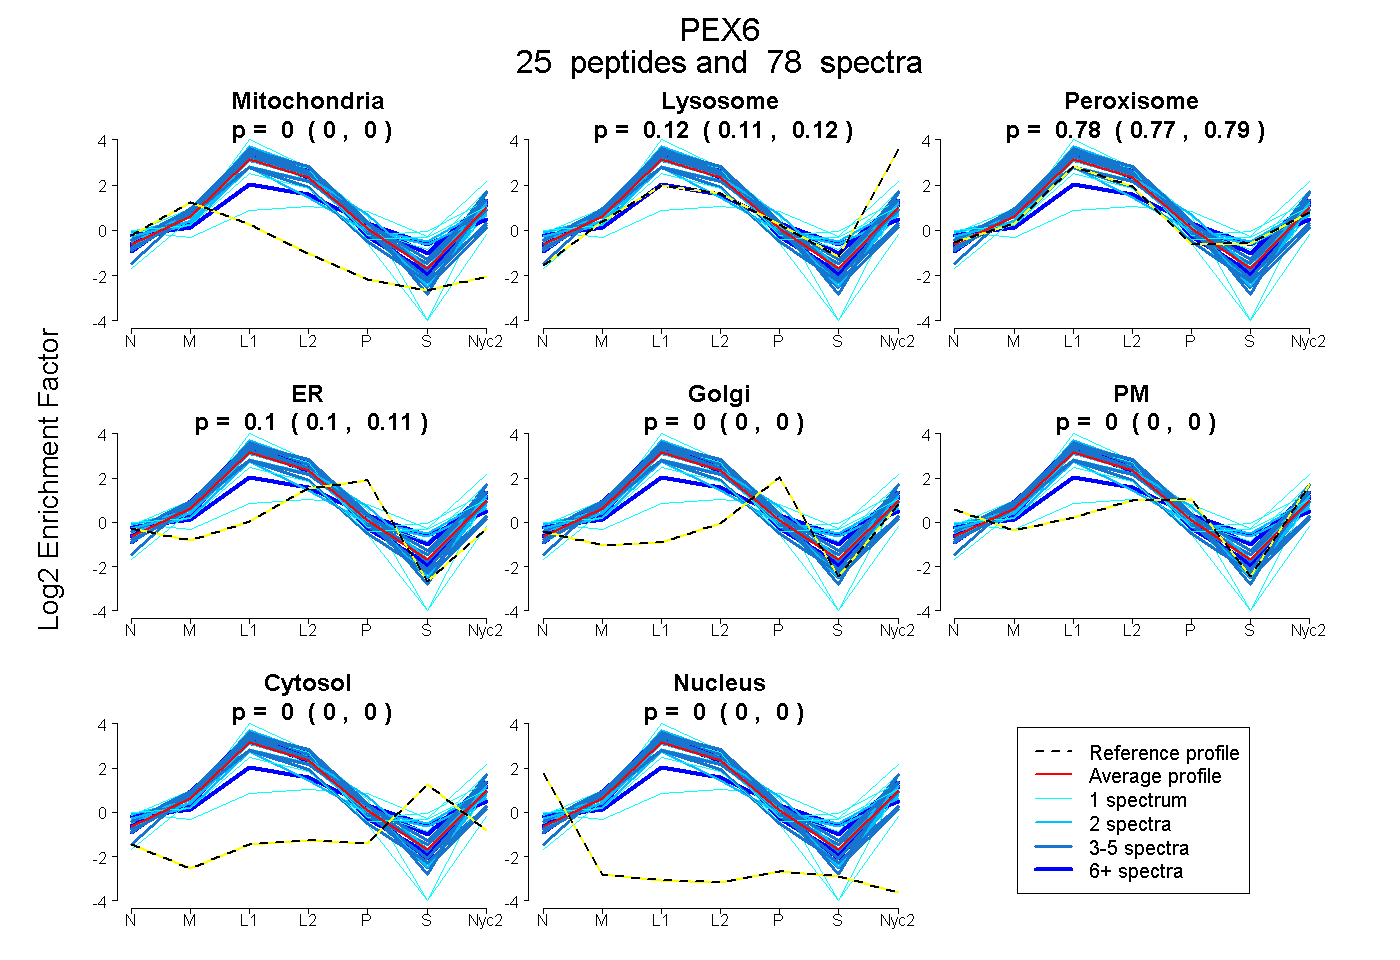
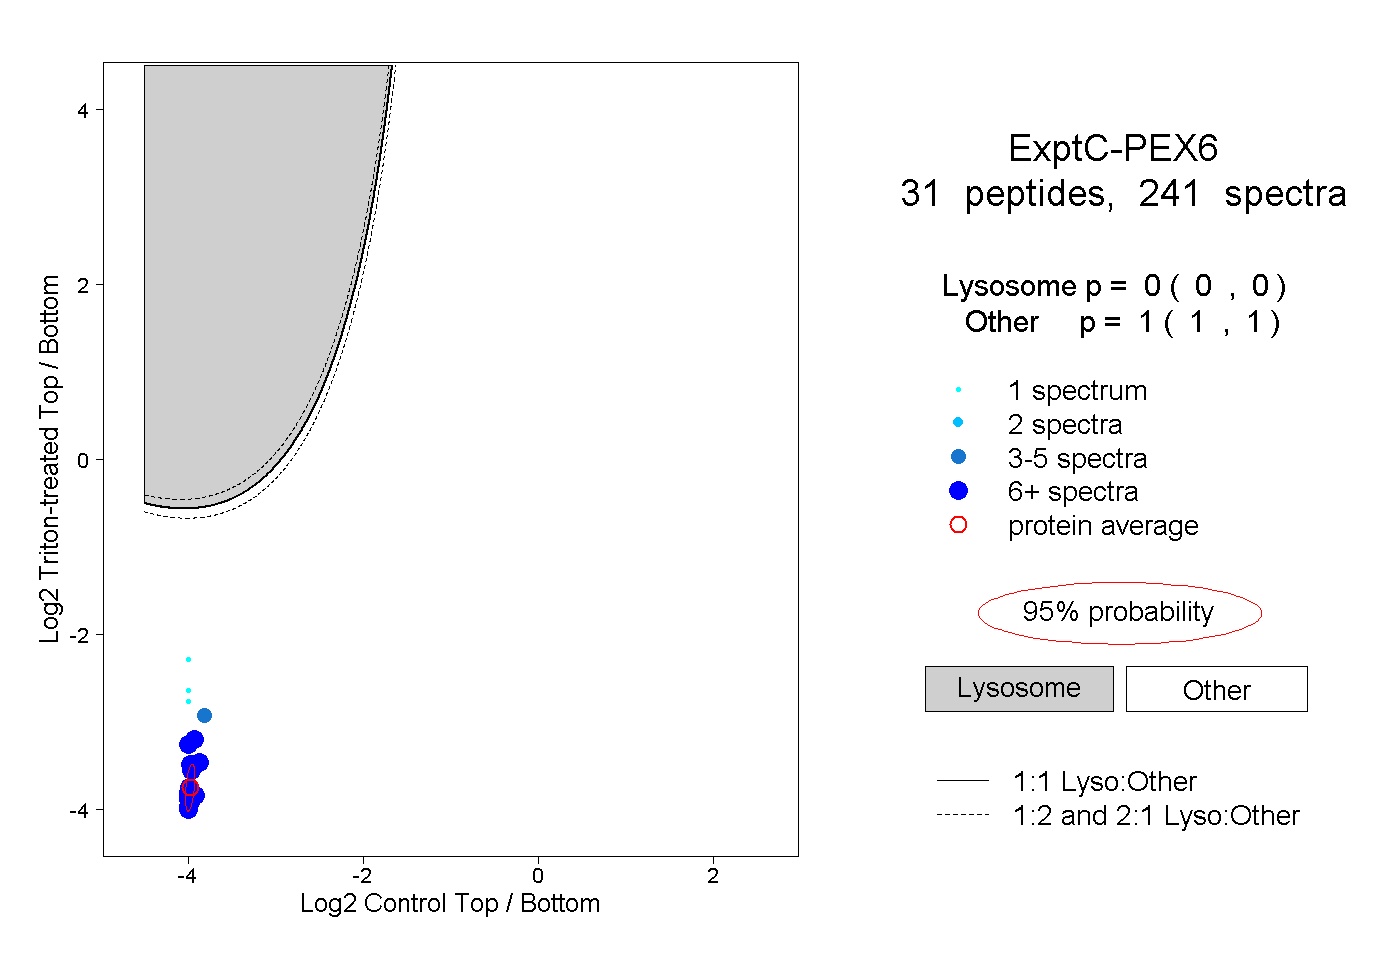
 25
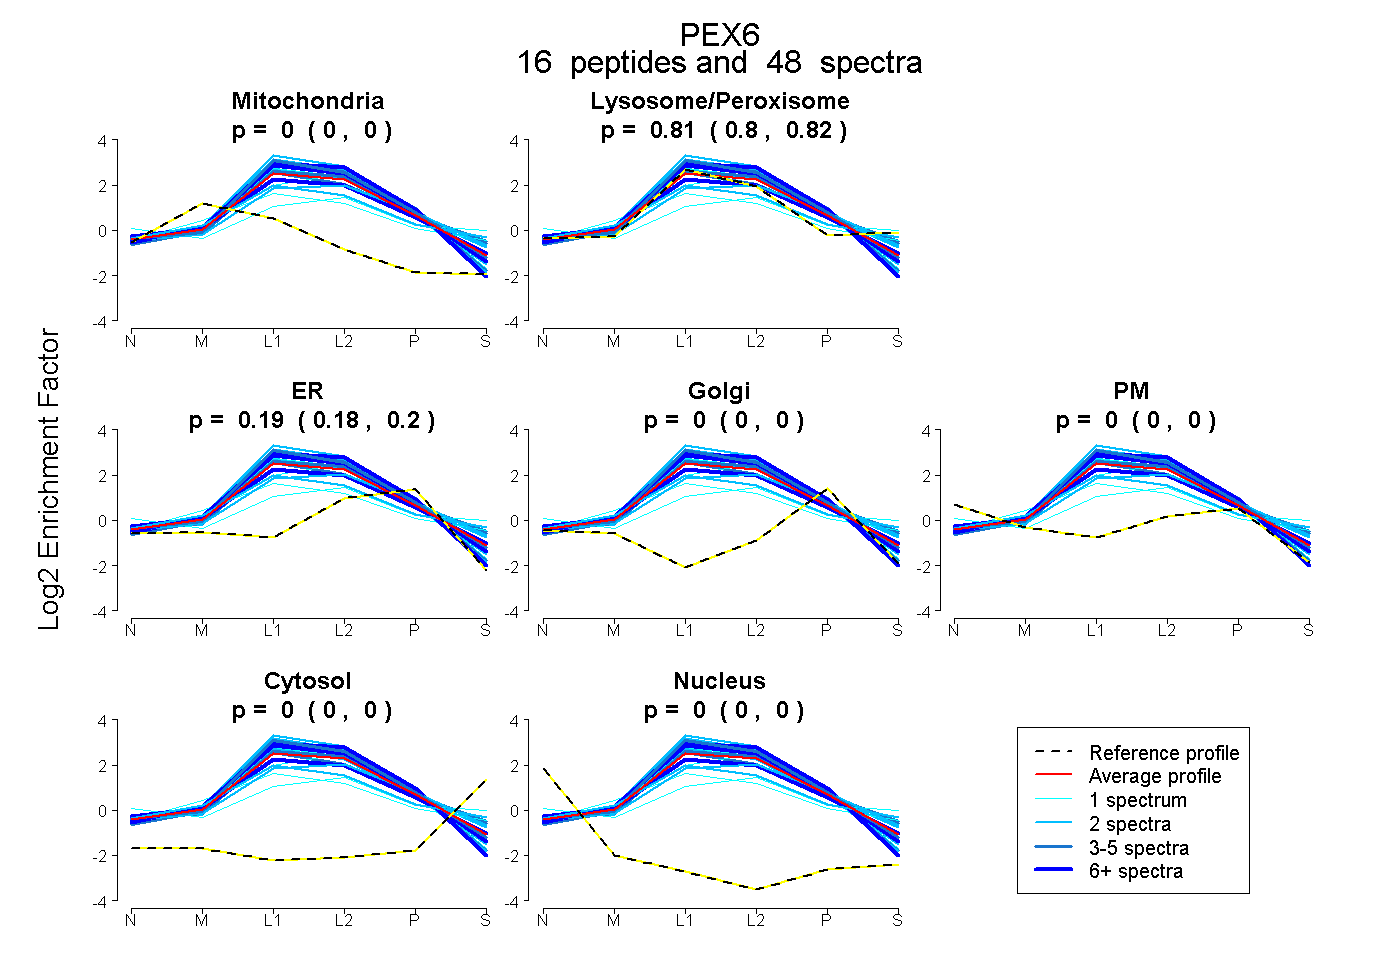
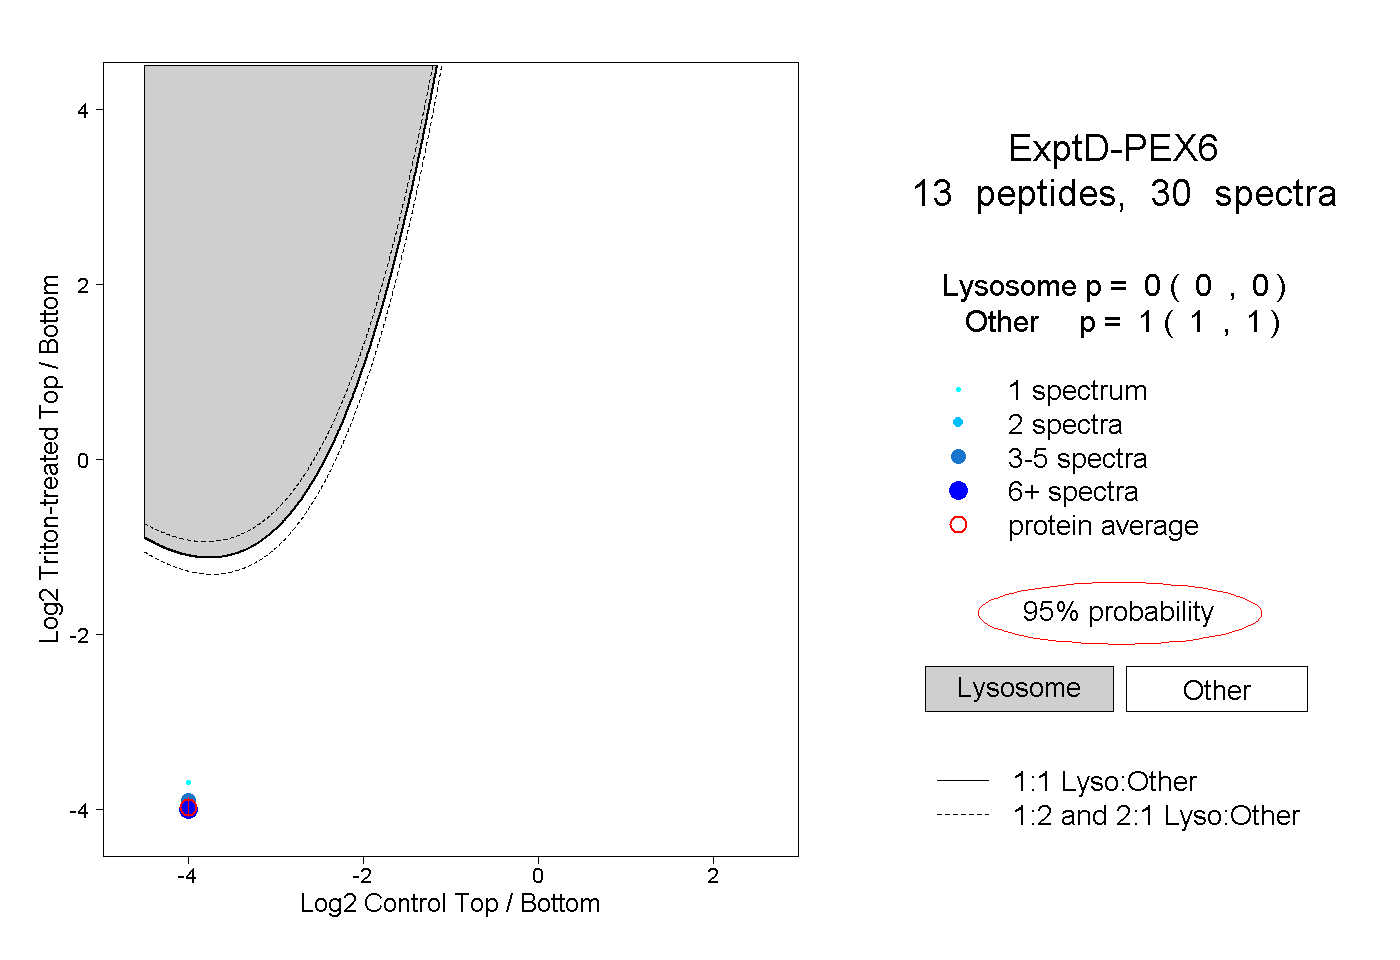
25