 25
25peptides
spectra
0.000 | 0.000
0.110 | 0.124
0.771 | 0.787
0.097 | 0.107
0.000 | 0.000
0.000 | 0.000
0.000 | 0.000
0.000 | 0.000
| Plot | Mito | Lyso | Perox | ER | Golgi | PM | Cytosol | Nucleus | |||||
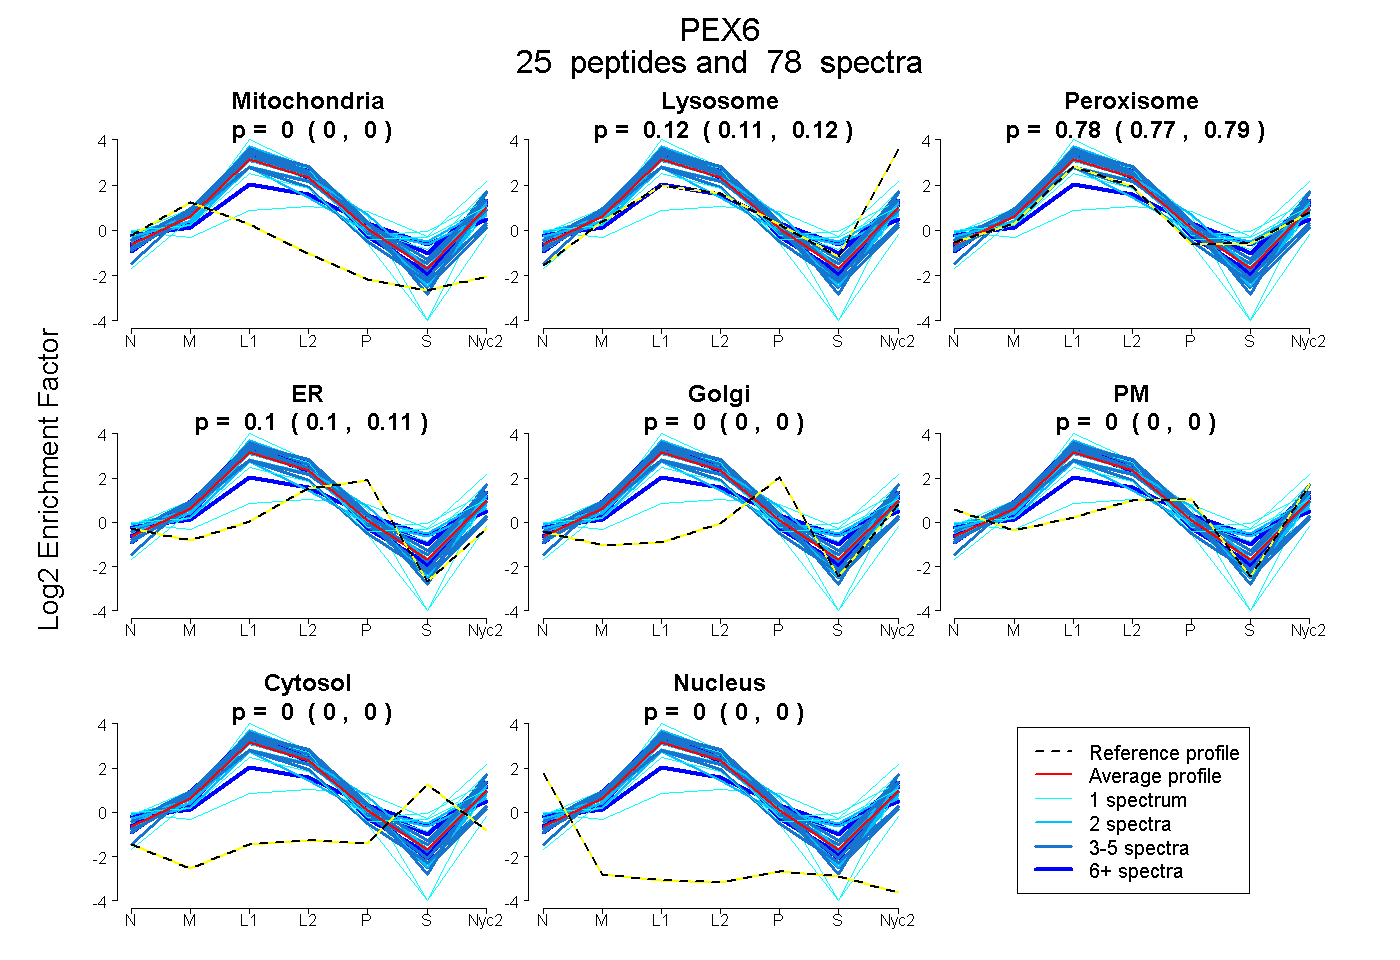
| Expt A |
25 peptides |
78 spectra |
|
0.000 0.000 | 0.000 |
0.118 0.110 | 0.124 |
0.780 0.771 | 0.787 |
0.102 0.097 | 0.107 |
0.000 0.000 | 0.000 |
0.000 0.000 | 0.000 |
0.000 0.000 | 0.000 |
0.000 0.000 | 0.000 |
| 1 spectrum, SLGLFQGEWVWVAR | 0.000 | 0.216 | 0.784 | 0.000 | 0.000 | 0.000 | 0.000 | 0.000 | ||
| 7 spectra, HLLLDEDPLSR | 0.000 | 0.000 | 0.741 | 0.155 | 0.080 | 0.000 | 0.024 | 0.000 | ||
| 2 spectra, VPPLPSGR | 0.000 | 0.094 | 0.874 | 0.032 | 0.000 | 0.000 | 0.000 | 0.000 | ||
| 1 spectrum, AAAPCIIFFDELDSLAPSR | 0.000 | 0.000 | 0.640 | 0.360 | 0.000 | 0.000 | 0.000 | 0.000 | ||
| 3 spectra, WDLSAR | 0.000 | 0.262 | 0.640 | 0.097 | 0.000 | 0.000 | 0.000 | 0.000 | ||
| 2 spectra, GPGPPPLLVSR | 0.000 | 0.043 | 0.824 | 0.133 | 0.000 | 0.000 | 0.000 | 0.000 | ||
| 2 spectra, VLSAITR | 0.000 | 0.167 | 0.655 | 0.178 | 0.000 | 0.000 | 0.000 | 0.000 | ||
| 2 spectra, LAVTELQGR | 0.000 | 0.037 | 0.955 | 0.008 | 0.000 | 0.000 | 0.000 | 0.000 | ||
| 5 spectra, VLALSPGAR | 0.000 | 0.123 | 0.765 | 0.112 | 0.000 | 0.000 | 0.000 | 0.000 | ||
| 3 spectra, LQPSVSEQELLR | 0.000 | 0.073 | 0.839 | 0.088 | 0.000 | 0.000 | 0.000 | 0.000 | ||
| 1 spectrum, YLEDSTAAEDK | 0.000 | 0.000 | 0.897 | 0.000 | 0.000 | 0.088 | 0.015 | 0.000 | ||
| 6 spectra, LGLHLLK | 0.000 | 0.169 | 0.816 | 0.015 | 0.000 | 0.000 | 0.000 | 0.000 | ||
| 5 spectra, SGDSGGVMDR | 0.000 | 0.323 | 0.674 | 0.003 | 0.000 | 0.000 | 0.000 | 0.000 | ||
| 4 spectra, VLETRPALQGLLGPGTR | 0.143 | 0.010 | 0.741 | 0.106 | 0.000 | 0.000 | 0.000 | 0.000 | ||
| 2 spectra, VGELPNTSQPHLAQVQVLEPR | 0.000 | 0.066 | 0.704 | 0.142 | 0.000 | 0.089 | 0.000 | 0.000 | ||
| 1 spectrum, GPELINMYVGQSEENVR | 0.000 | 0.379 | 0.090 | 0.000 | 0.000 | 0.377 | 0.154 | 0.000 | ||
| 6 spectra, GVLGGTGDALGVSR | 0.000 | 0.156 | 0.804 | 0.040 | 0.000 | 0.000 | 0.000 | 0.000 | ||
| 3 spectra, LVFVGASEDR | 0.000 | 0.147 | 0.853 | 0.000 | 0.000 | 0.000 | 0.000 | 0.000 | ||
| 4 spectra, CPPLMVVATTSR | 0.003 | 0.000 | 0.846 | 0.151 | 0.000 | 0.000 | 0.000 | 0.000 | ||
| 5 spectra, TTAVTAACSR | 0.000 | 0.000 | 0.833 | 0.167 | 0.000 | 0.000 | 0.000 | 0.000 | ||
| 3 spectra, VQDLPTDVR | 0.000 | 0.430 | 0.475 | 0.095 | 0.000 | 0.000 | 0.000 | 0.000 | ||
| 6 spectra, DLEEGLEPR | 0.000 | 0.184 | 0.798 | 0.018 | 0.000 | 0.000 | 0.000 | 0.000 | ||
| 2 spectra, SGLLLHGPPGTGK | 0.000 | 0.000 | 0.906 | 0.000 | 0.094 | 0.000 | 0.000 | 0.000 | ||
| 1 spectrum, LQTTFSR | 0.000 | 0.301 | 0.699 | 0.000 | 0.000 | 0.000 | 0.000 | 0.000 | ||
| 1 spectrum, TAFPHELEVPVLSESQR | 0.046 | 0.091 | 0.653 | 0.000 | 0.000 | 0.210 | 0.000 | 0.000 |
| Plot | Mito | Lyso or Perox | ER | Golgi | PM | Cytosol | Nucleus | ||||||
| Expt B |
16 peptides |
48 spectra |
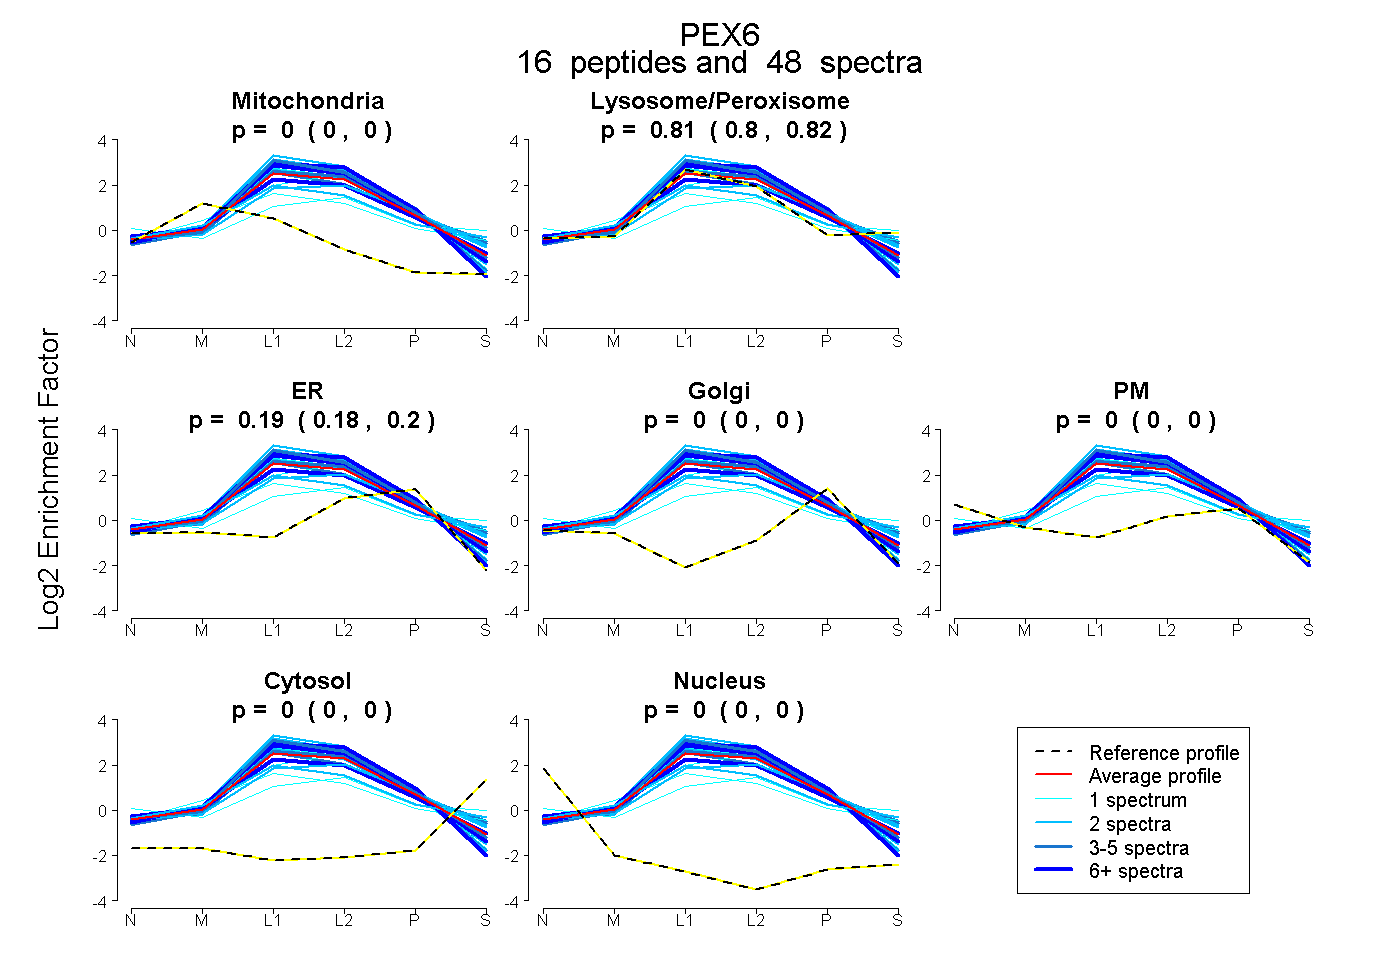 |
0.000 0.000 | 0.000 |
0.811 0.802 | 0.819 |
0.189 0.180 | 0.196 |
0.000 0.000 | 0.000 |
0.000 0.000 | 0.000 |
0.000 0.000 | 0.000 |
0.000 0.000 | 0.000 |
|||
| Plot | Lyso | Other | |||||||||||
| Expt C |
31 peptides |
241 spectra |
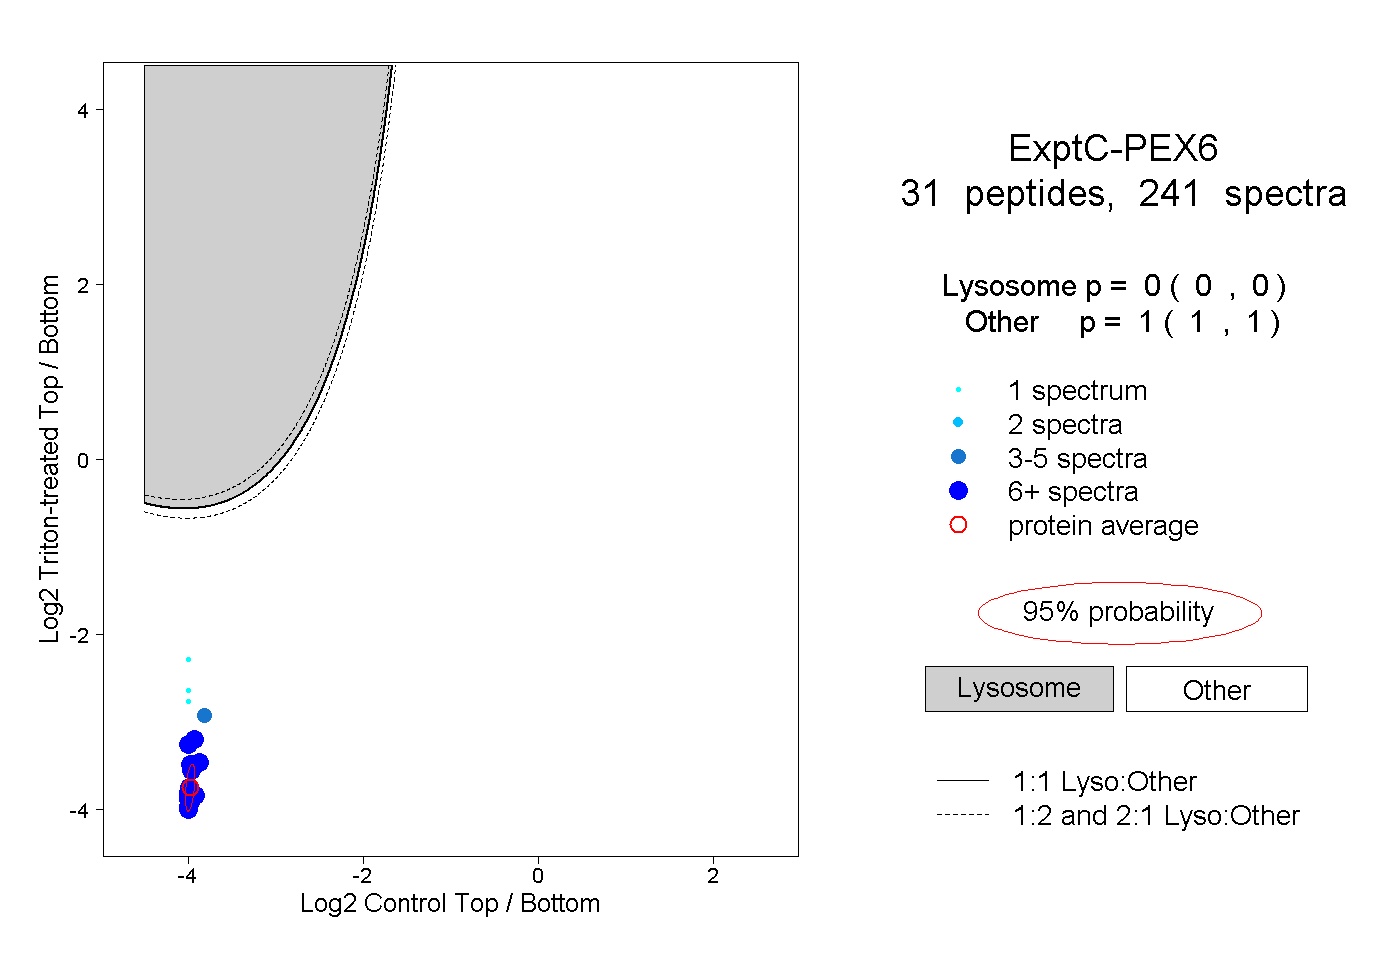 |
0.000 0.000 | 0.000 |
1.000 1.000 | 1.000 |
||||||||
| Plot | Lyso | Other | |||||||||||
| Expt D |
13 peptides |
30 spectra |
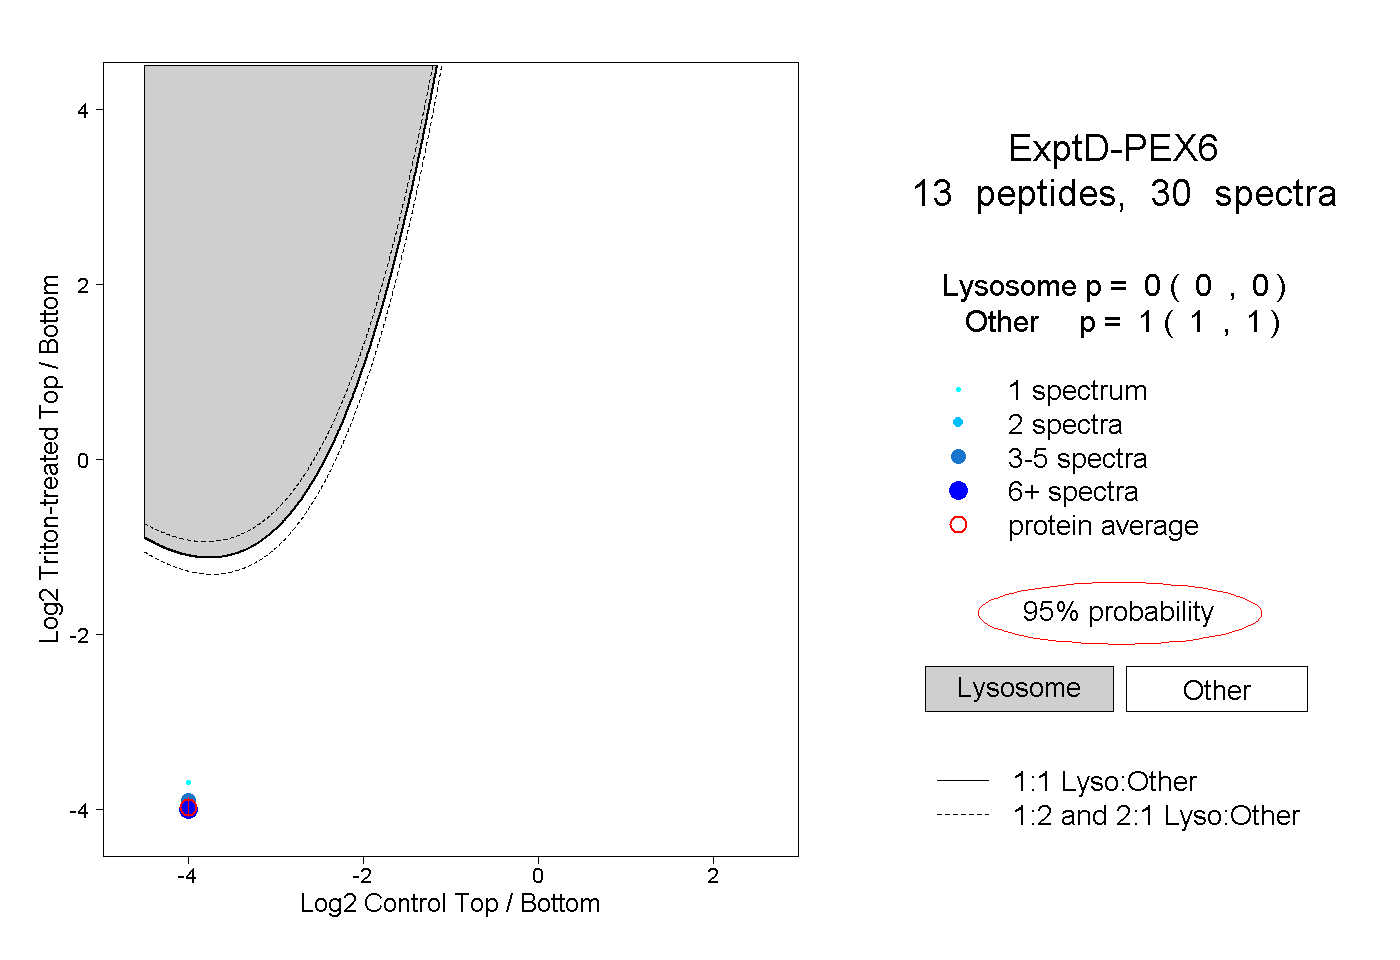 |
0.000 0.000 | 0.000 |
1.000 1.000 | 1.000 |