13
13peptides
spectra
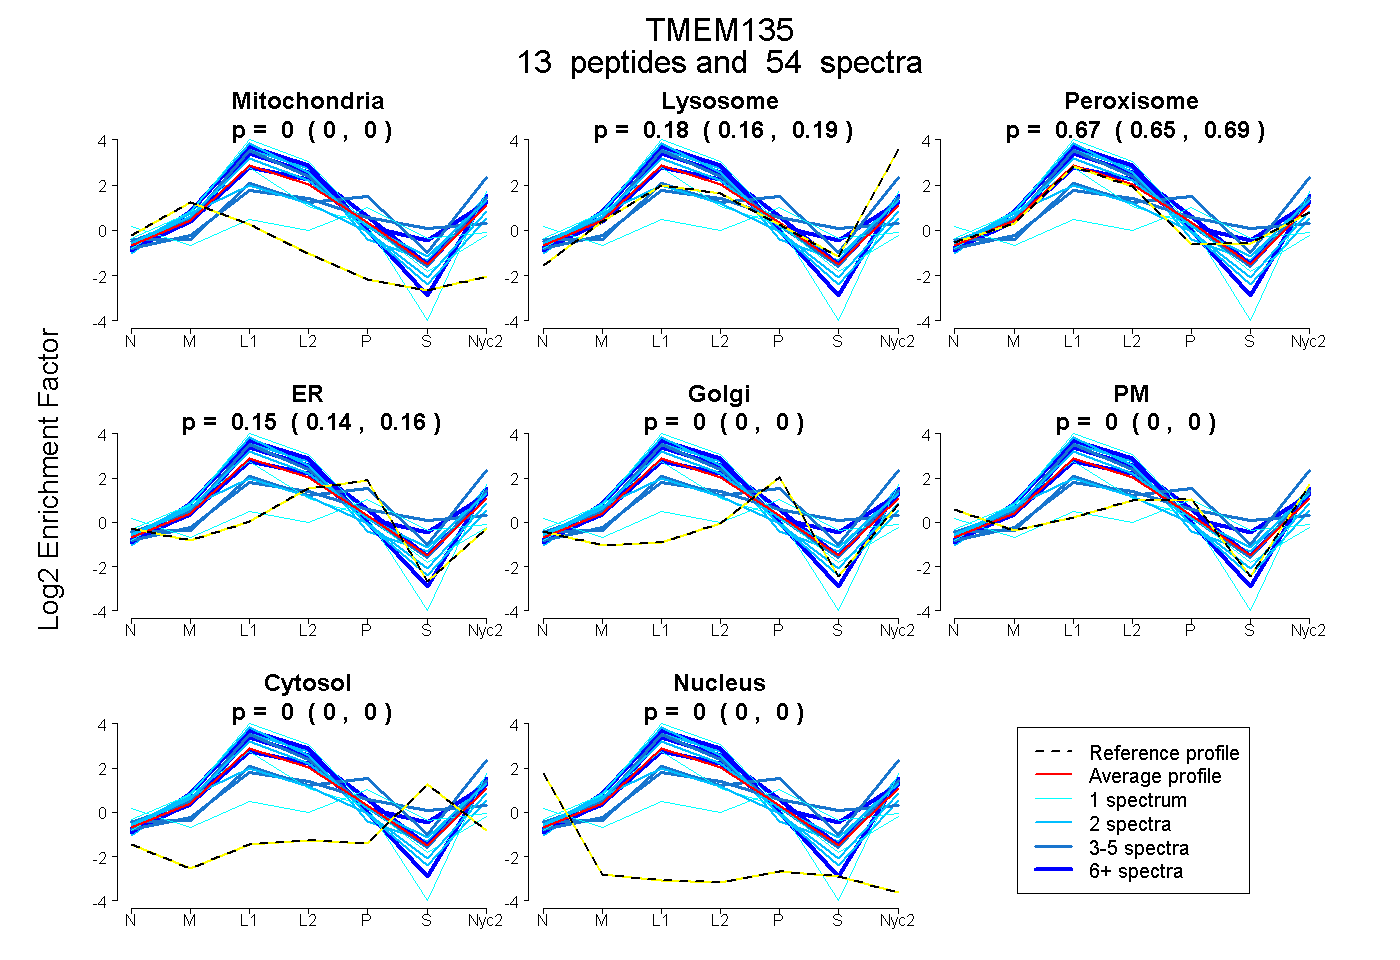
0.000 | 0.000
0.162 | 0.192
0.650 | 0.688
0.137 | 0.162
0.000 | 0.000
0.000 | 0.000
0.000 | 0.000
0.000 | 0.000
9peptides
spectra
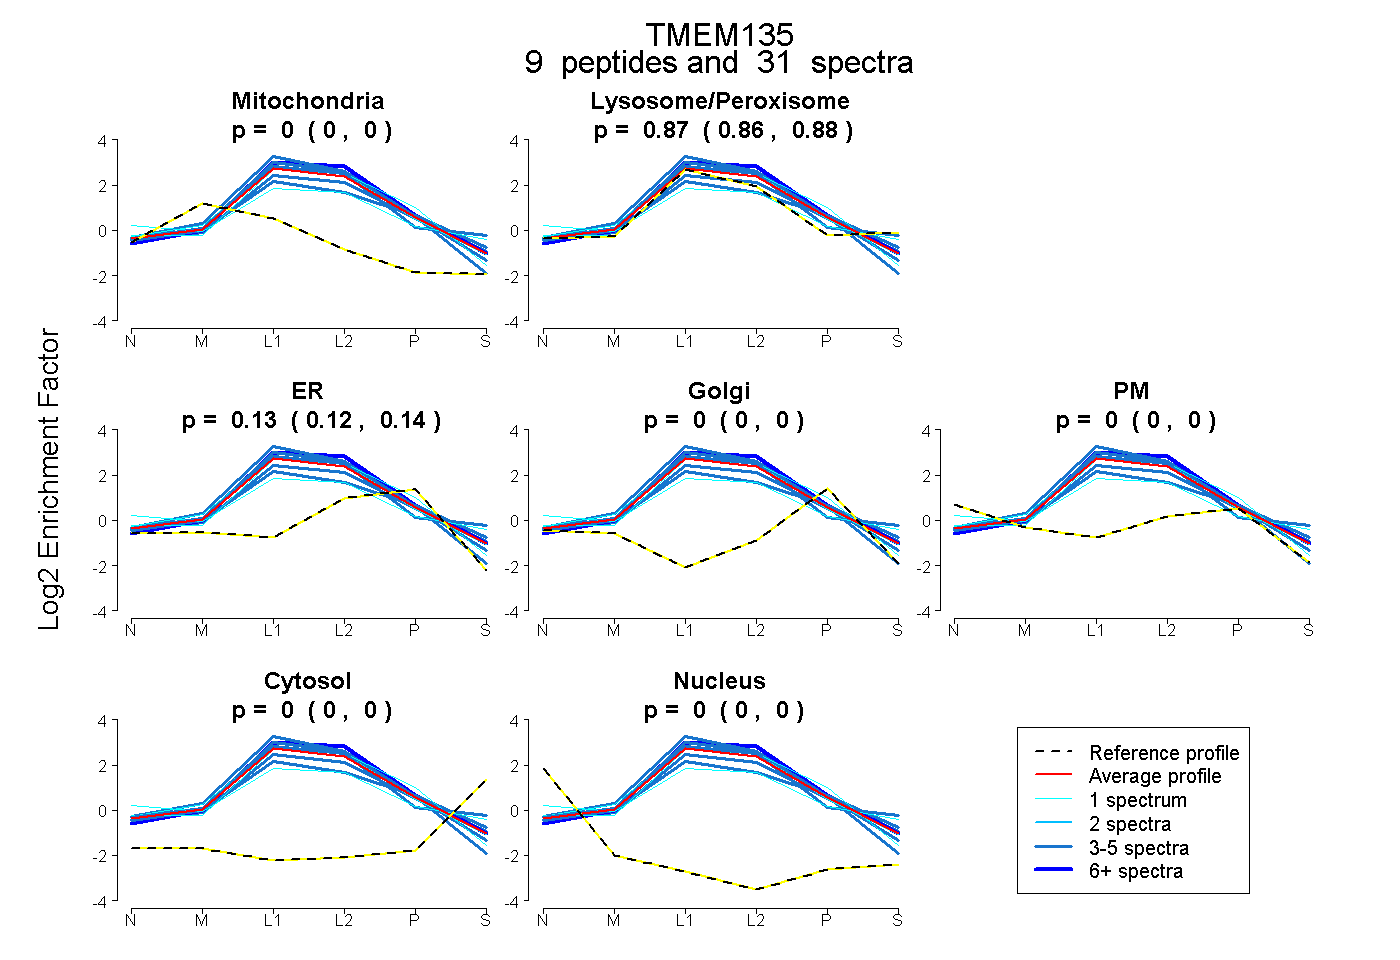
0.000 | 0.000
0.857 | 0.878
0.120 | 0.141
0.000 | 0.000
0.000 | 0.000
0.000 | 0.000
0.000 | 0.000
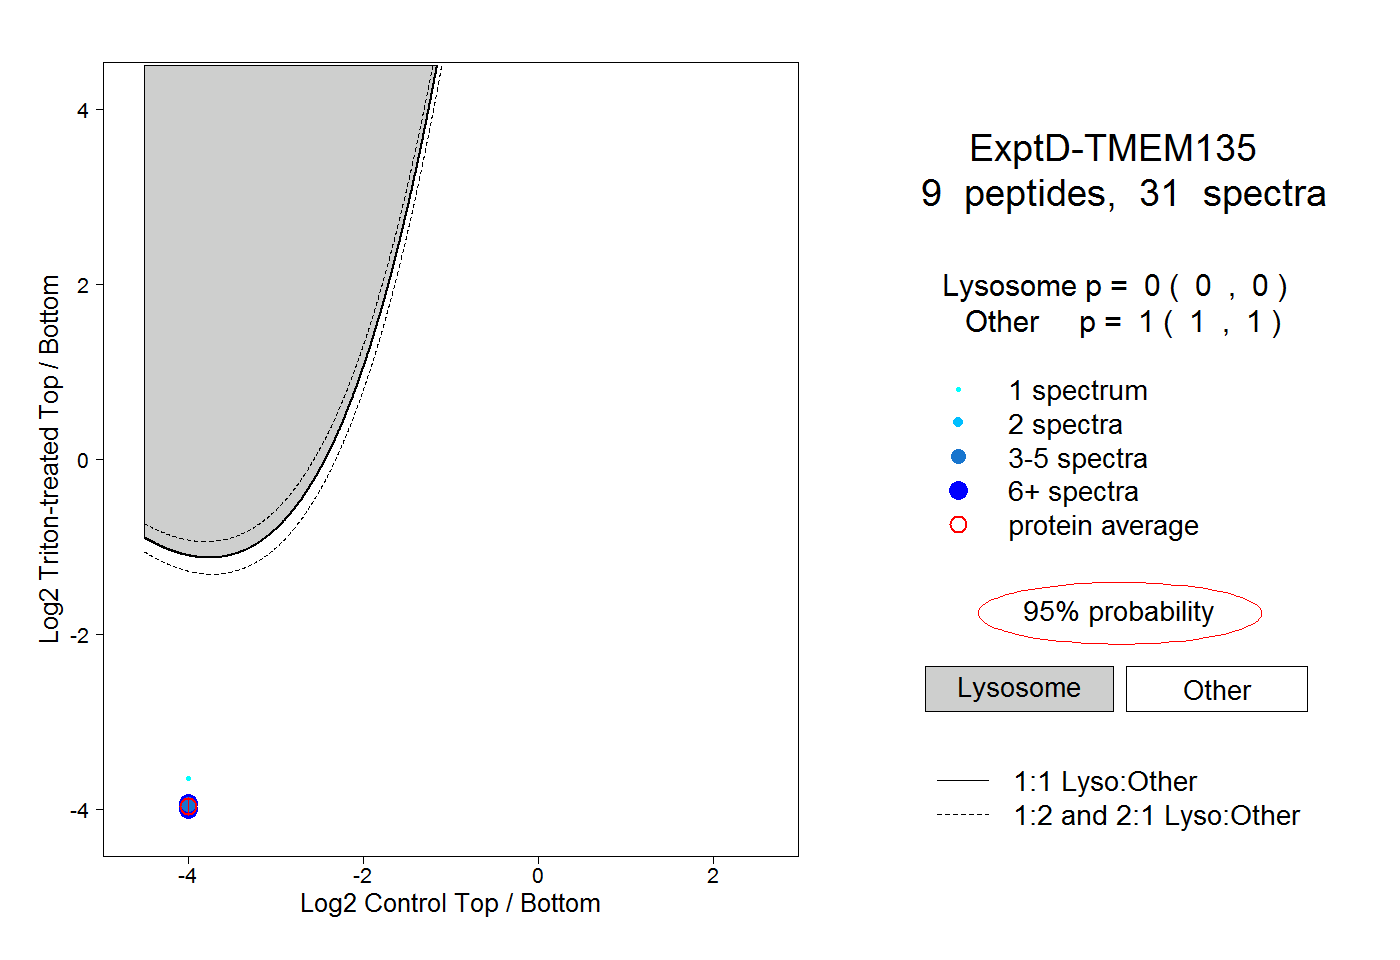
20peptides
spectra
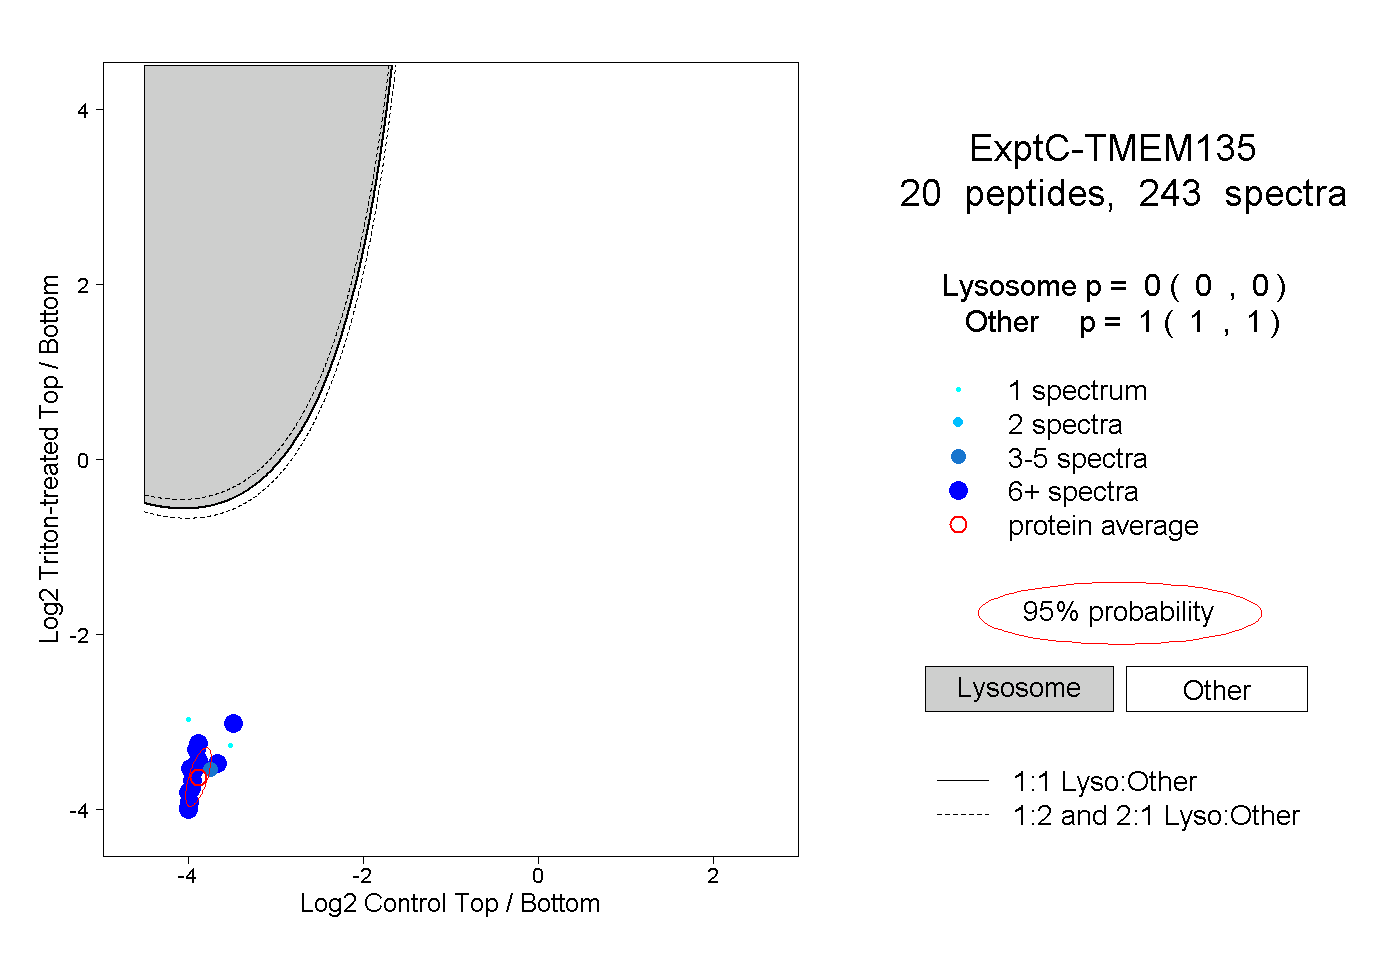
0.000 | 0.000
1.000 | 1.000