TMEM135
[ENSRNOP00000022578]
Main page
| | | Plot |
Mito |
Lyso |
|
Perox |
ER |
Golgi |
PM |
Cytosol |
Nucleus |
|
| Expt A |
 13
13
peptides |
54
spectra |
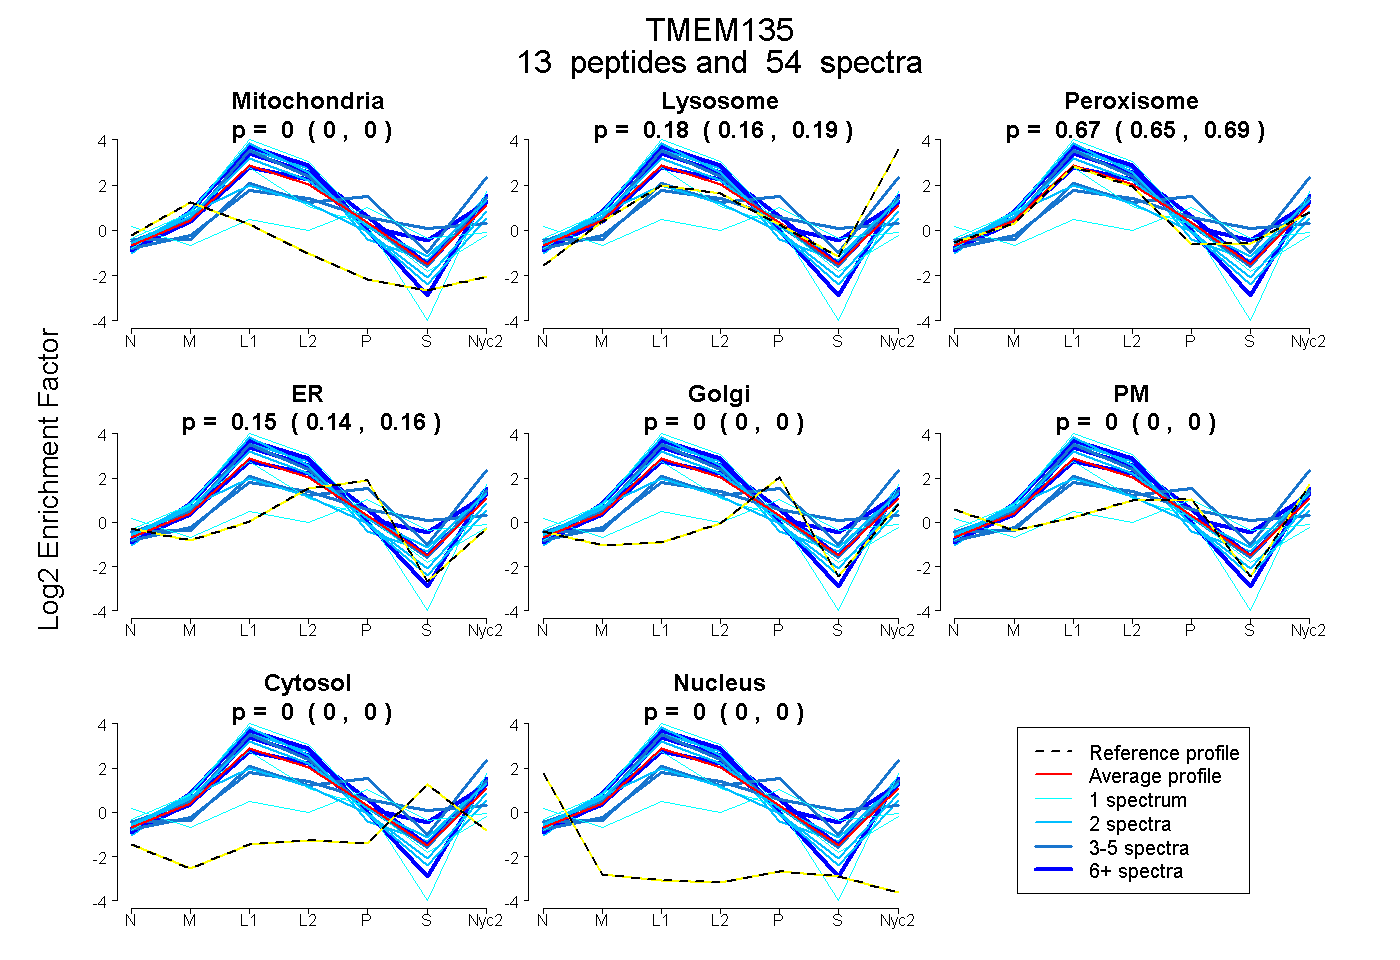 |
0.000
0.000 | 0.000 |
0.178
0.162 | 0.192 |
|
0.671
0.650 | 0.688 |
0.150
0.137 | 0.162 |
0.000
0.000 | 0.000 |
0.000
0.000 | 0.000 |
0.000
0.000 | 0.000 |
0.000
0.000 | 0.000 |
|
| | | Plot |
Mito |
|
Lyso or Perox |
|
ER |
Golgi |
PM |
Cytosol |
Nucleus |
|
| Expt B |
9
peptides |
31
spectra |
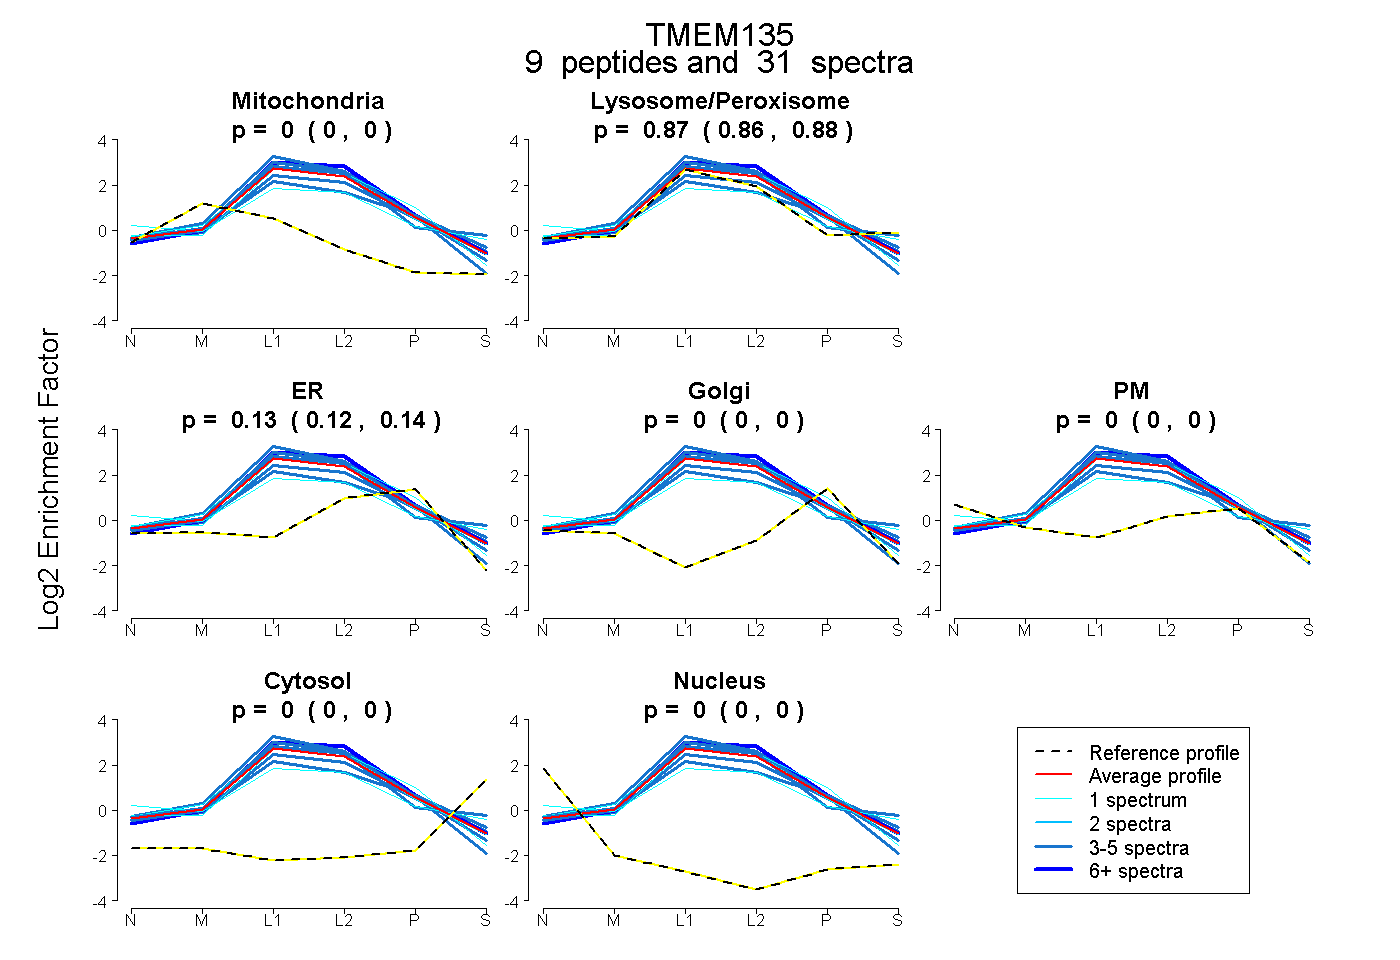 |
0.000
0.000 | 0.000 |
|
0.868
0.857 | 0.878 |
|
0.132
0.120 | 0.141 |
0.000
0.000 | 0.000 |
0.000
0.000 | 0.000 |
0.000
0.000 | 0.000 |
0.000
0.000 | 0.000 |
|
| 5 spectra, EFHNFIPR |
0.000 |
|
0.755 |
|
0.245 |
0.000 |
0.000 |
0.000 |
0.000 |
|
| 1 spectrum, GTSCFLR |
0.000 |
|
0.888 |
|
0.112 |
0.000 |
0.000 |
0.000 |
0.000 |
|
| 3 spectra, GTITTLR |
0.000 |
|
0.877 |
|
0.123 |
0.000 |
0.000 |
0.000 |
0.000 |
|
| 1 spectrum, SLVDSICK |
0.000 |
|
0.757 |
|
0.000 |
0.000 |
0.243 |
0.000 |
0.000 |
|
| 4 spectra, GFTFSALR |
0.000 |
|
0.894 |
|
0.106 |
0.000 |
0.000 |
0.000 |
0.000 |
|
| 3 spectra, ALDVFGTGASR |
0.000 |
|
0.820 |
|
0.180 |
0.000 |
0.000 |
0.000 |
0.000 |
|
| 3 spectra, LLSLFYNK |
0.000 |
|
1.000 |
|
0.000 |
0.000 |
0.000 |
0.000 |
0.000 |
|
| 10 spectra, AMSLIALVR |
0.000 |
|
0.924 |
|
0.076 |
0.000 |
0.000 |
0.000 |
0.000 |
|
| 1 spectrum, IPSAFR |
0.000 |
|
0.780 |
|
0.220 |
0.000 |
0.000 |
0.000 |
0.000 |
|
| | | Plot |
|
Lyso |
|
|
|
|
|
|
|
Other |
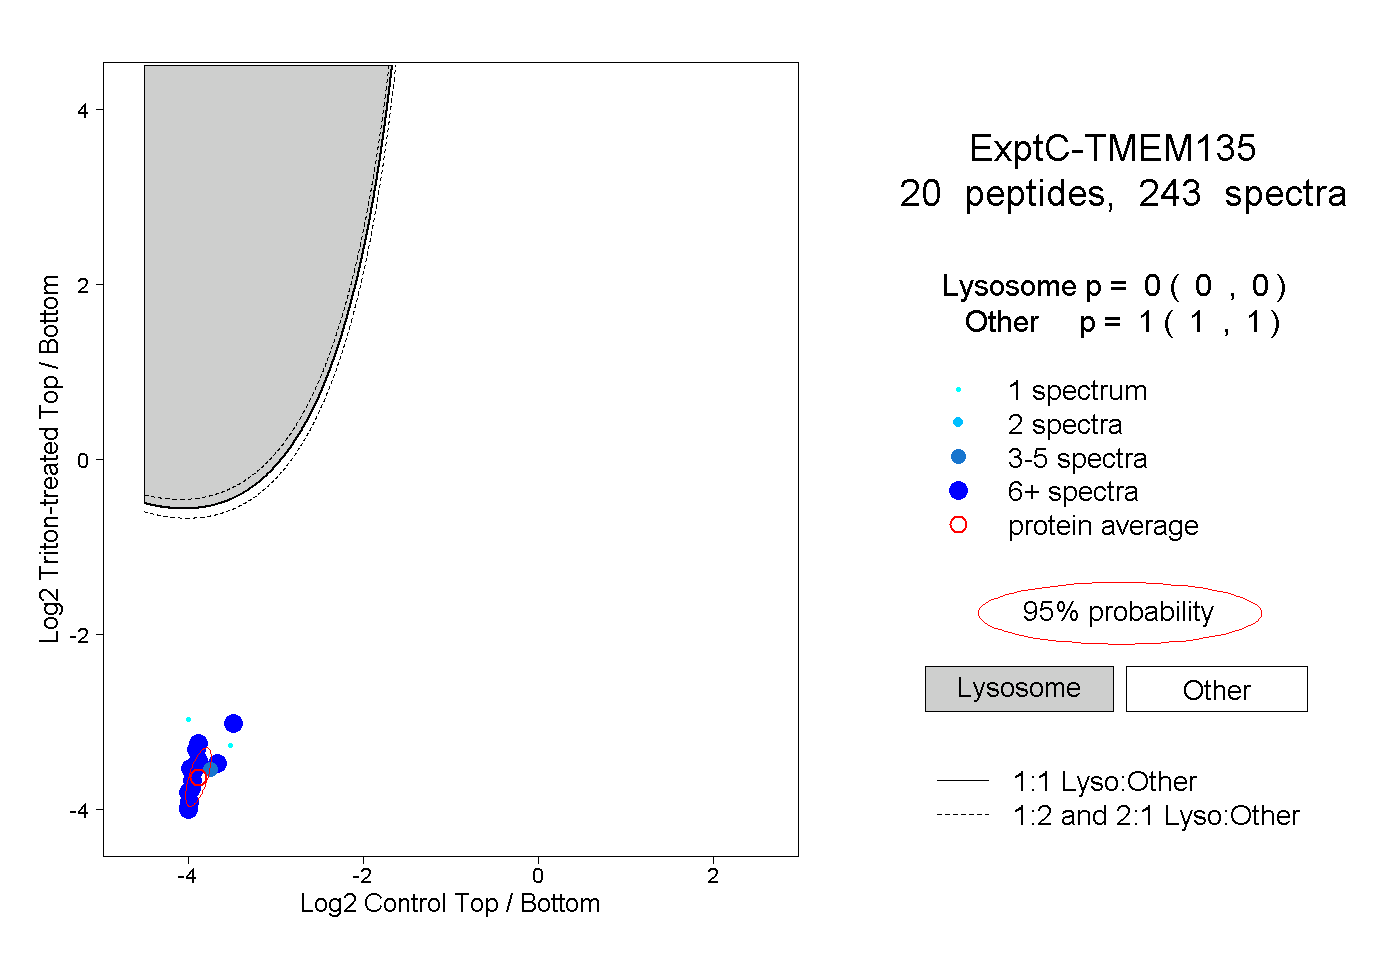
| Expt C |
20
peptides |
243
spectra |
 |
|
0.000
0.000 | 0.000 |
|
|
|
|
|
|
|
1.000
1.000 | 1.000 |
| | | Plot |
|
Lyso |
|
|
|
|
|
|
|
Other |
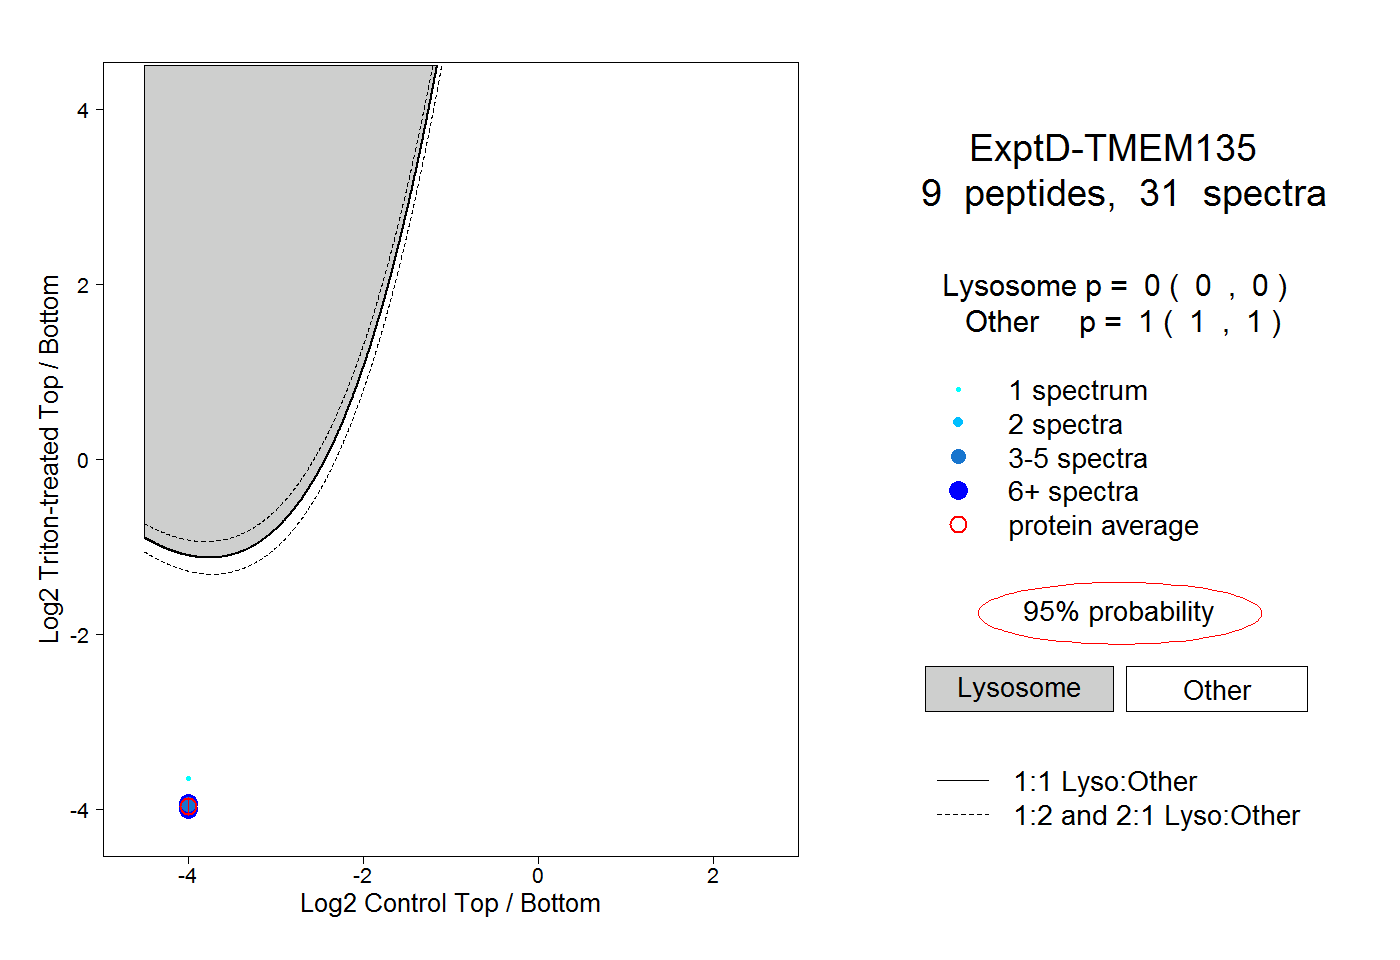
| Expt D |
9
peptides |
31
spectra |
 |
|
0.000
0.000 | 0.000 |
|
|
|
|
|
|
|
1.000
1.000 | 1.000 |